Stock Markets Hit by Waves of Debt Crisis Uncertainty
Stock-Markets / Financial Markets 2010 Feb 28, 2010 - 05:07 AM GMT As investors vacillated about the impact of developments in Greece, together with the uncertainty of strong fourth-quarter economic data possibly not carrying over to the first quarter, stock markets experienced two sharp sell-offs and two rebound rallies, limping to small gains on Friday but ending the week modestly down.
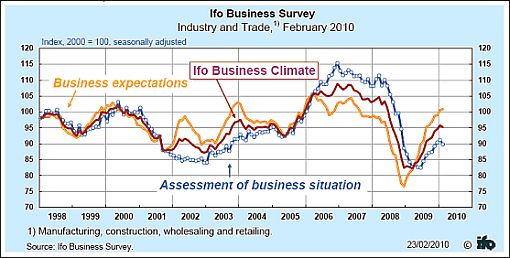
Renewed fears over Greece’s debt woes, disappointing German business confidence statistics and lower-than-expected US consumer confidence data tempered investor optimism for risky assts, triggering haven demand for government bonds and the Japanese yen.
Fed Chairman Ben Bernanke provided some support for stock markets on Wednesday by indicating in his testimony to the US House Financial Services Committee that the fed fund rate will remain at exceptionally low levels for an extended period. However, the flip side of the coin is his gloomy picture of the economy still battling high unemployment and a weak housing sector.
“Greece hasn’t gotten so much press since 146 BC when the Romans took over,” said Paul Kasriel (Northern Trust). In news after the close of the markets, the Financial Times reported: “Germany’s biggest banks are looking at a rescue plan for Greece under which they would buy Greek debt backed by financial guarantees from Berlin. One senior German bank official said serious thought was being given to a plan for the German government, working through KfW, its development bank, to issue guarantees to banks that bought Greek debt.”
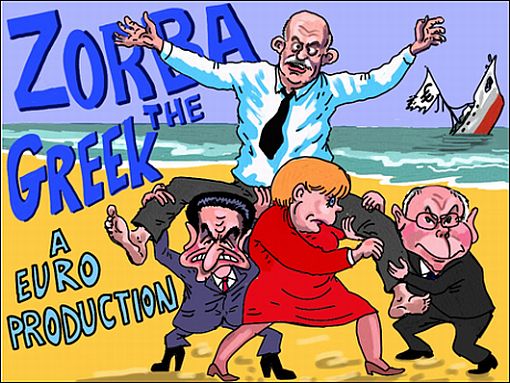
Source: Patrick Blower, Guardian
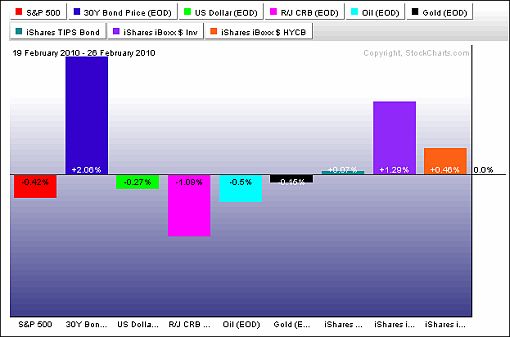
The past week’s performance of the major asset classes is summarized in the chart below - a set of numbers indicating that a degree of risk aversion has crept back into financial markets. Interestingly, unlike equities, both investment-grade and high-yield corporate bonds ended the week in the black. “We believe investors can capture attractive yields and excess spread in the high-yield market with relatively low default risk,” Andrew Jessop, high-yield portfolio manager at Pimco, said in a note on the company’s website (via MoneyNews).
Source: StockCharts.com
A summary of the movements of major global stock markets for the past week and various other measurement periods is given in the table below.
It was essentially a flat week, with the MSCI World Index declining by 0.1%, but the MSCI Emerging Markets Index managing to eke out a positive return of 0.3%. With the Chinese returning from the lunar holiday, Hong Kong (+3.6%) put in one of the better performances among important markets, whereas mainland China (+1.1%) also closed the week in the black.
Notwithstanding the huge rally since the March lows, only the Chile Stock Market General Index has been able to reclaim its 2007 pre-crisis peak and is now trading 9.4% higher. Mexico could be the next country to eliminate the bear market losses.
Click here or on the table below for a larger image.
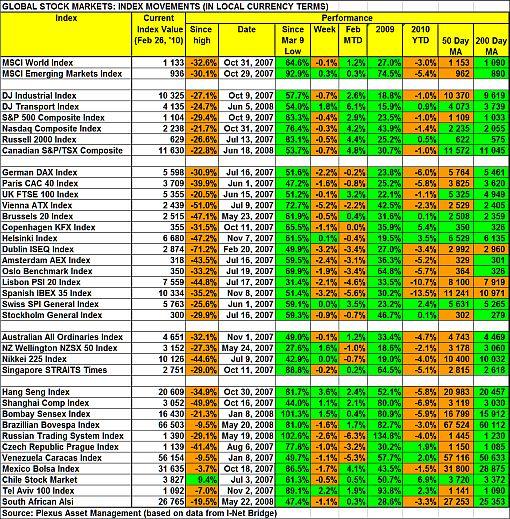
Top performers among stock markets this week were Ukraine (+4.5%), Greece (+3.7%), Hong Kong (+3.6%), Cyprus (+3.2%) and Thailand (+3.0%). At the bottom end of the performance rankings, countries included Turkey (‑6.8%), Malta (-5.7%), Austria (-5.2%), Argentina (-4.9%) and Latvia (-4.2%). Turkey suffered from tensions between the government and the military. Debt-ridden European countries such as Italy (-3.2%), Spain (-3.2%), Ireland (-3.2%) and Portugal (-2.1%) featured strongly at the bottom end of the performance ranking.
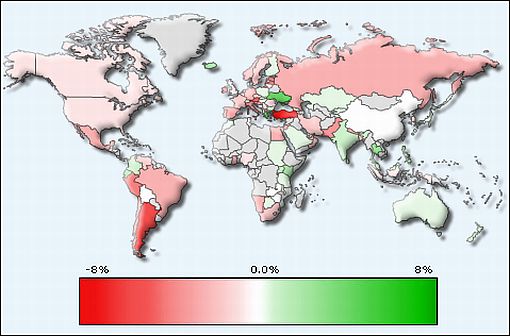
Of the 96 stock markets I keep on my radar screen, 33% recorded gains, 60% showed losses and 7% remained unchanged. The performance map below tells the past week’s somewhat bearish story.
Emerginvest world markets heat map
Source: Emerginvest (Click here to access a complete list of global stock market movements.)
Eight of the ten economic sectors of the S&P 500 Index closed lower for the week, with Financials and Consumer Discretionary the only two sectors not under water. (Who would have guessed the Conference Board’s Consumer Confidence Index would fall to its lowest level since July 2009 on Tuesday?)
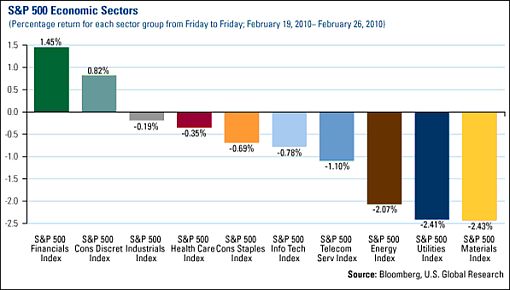
Source: US Global Investors - Weekly Investor Alert, February 26, 2010.
John Nyaradi (Wall Street Sector Selector) reports that as far as exchange-traded funds (ETFs) are concerned, the winners for the week included Vanguard Extended Duration Treasury (EDV) (+4.3%), iShares MSCI Thailand (THD) (+3.9%) and CurrencyShares Japanese Yen (FXY) (+3.1%).
At the bottom end of the performance rankings, ETFs included iShares MSCI Turkey (TUR) (-8.8%), Claymore/MAC Global Solar Energy (TAN) (-7.2%) and United States Natural Gas (UNG) (down 5.1%).
Referring to a regulatory report released on Tuesday by the Federal Deposit Insurance Corp (FDIC), the quote du jour this week comes from Addison Wiggin, co-author of Financial Reckoning Day Fallout and The New Empire of Debt. He said in a column on The Daily Reckoning site: “The FDIC is even more broke than it was three months ago. The fund the FDIC uses to ‘insure’ your bank account went $20.9 billion in the red during the fourth quarter of 2009. That’s more than twice the deficit reported when the fund first entered negative territory in the previous quarter. Incredibly, the FDIC is still trying to reassure us that all is well because it’s collecting three years of advance payments on the annual assessments paid by its member banks. The fees total $45 billion - barely twice the amount of the current deficit. Yeah, we feel better.
“On top of that, the FDIC’s list of ‘problem banks’ grew during the fourth quarter from 552 to 702. That’s the highest number since 1993 (when, we presume, more independently owned banks were around, so it’s worse than it sounds). Hmmm, let’s see. The number grew 27% in just one quarter. At this pace, every bank in the country will be on the problem list by the fourth quarter of 2012. Another tidbit from the FDIC’s report: Bank lending last year dropped at the biggest clip since 1942. Of course, in that year, the entire economy was shifting to a war footing. So it’s safe to say what we’re seeing now is another unprecedented postwar occurrence.”
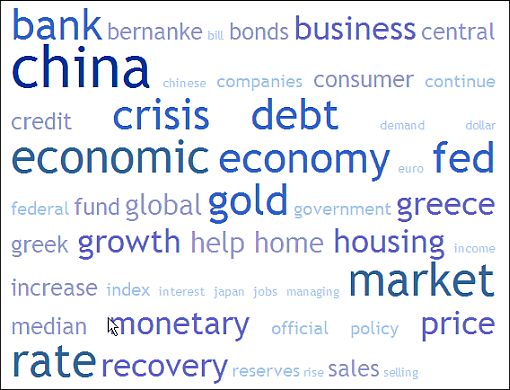
Next, a quick textual analysis of my week’s reading. This is a way of visualizing word frequencies at a glance. “Bank”, “debt”, “economy”, “Fed”, “rate” and “market” all featured prominently, but it was somewhat surprising to see “China” commanding more media mentions than “Greece”.
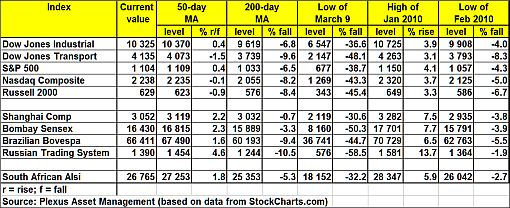
The major moving-average levels for the benchmark US indices, the BRIC countries and South Africa (where I am based in Cape Town when not traveling) are given in the table below. With the exception of the Dow Jones Transportation Index, the Nasdaq Composite Index and the Russell 2000 Index, the indices in the table are all trading below their 50-day moving averages, but all the indices are still above their respective key 200-day moving averages. However, a red light is starting to flash regarding the Shanghai Composite Index, which is within striking distance (20 basis points) of this key support line.
Click here or on the table below for a larger image.
Commenting on the technical picture of the S&P 500, Kevin Lane (Fusion IQ) said: “The Index hit minor resistance a few trading sessions back near the 1,112 level. Until this level is taken out the near-term directional bias remains neutral. Lower down, the key level to watch is in the 1,072 area. This support level represents a much more significant uptrend line and if violated would suggest a bigger correction.
“Sentiment indicators are neutral at present, which is a positive, while market breadth remains a mixed bag. Clearly the recent trading activity suggests volatility will be more present in day-to-day trading than over the past few months.”
On the topic of charts, when considering S&P 500 monthly data, going back to 1998, three momentum-type oscillators (RSI, MACD and ROC) all still signal a bullish trend (see chart below). According to Yahoo Finance - Tech Ticker, Barry Ritholtz (The Big Picture) is not as bullish as he was last March when he called the market bottom, but is sticking with stocks. “The easy thing to do now would be to go to cash,” he said, “[But] I rarely find the easy trade is the one that makes you money.” (Incidentally, the long-term chart for US government bonds is in bearish mode.)
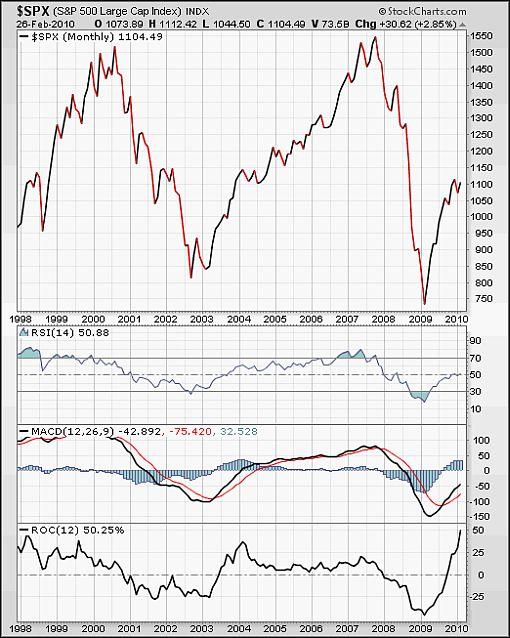
Source: StockCharts.com
David Rosenberg, chief economist and strategist of Gluskin Sheff & Associates, said: “Let’s face it, the surprise two months into the year is that the stock market is down more than 1% and 10-year Treasury yields are also down 20bps. It is still early in the year to be sure but it also seems clear that the economic data are starting to show some fragility. The S&P 500 has done little more than hover around the 1,100 mark now for six months in what can only be classified as a major topping formation. The VIX index is at 20, not 40; market vane sentiment is closer to 60 than 30; the US dollar is strong, not weak; policies are moving tighter, not easier; and the government is now aiming to curtail the banks whereas a year ago it was all about saving them.
“With a V-shaped earnings recovery already priced in and economic houses, like MacroEconomic Advisors, calling for 4% GDP growth for 2010, it certainly is difficult to highlight where the upside surprises for the market are going to be.”
From across the pond, David Fuller (Fullermoney) adds the following perspective: “Do we have a real crisis today? It is real enough for Southern European countries and obviously heightens sovereign debt concerns from Greece to the USA via the UK, but is this another global crisis? I do not think so, at least not yet although the OECD countries’ problems are far from resolved.
“The loss of upside momentum by most stock markets and many commodities, including precious metals, clearly indicates that global investors have reduced leveraged exposure in the last three months. Whether this is a normal correction (our previously stated 40% possibility) or likely to become a self-feeding and more significant pullback (also a 40% possibility) is hard to gauge, but action near the 200-day moving averages will be revealing. Even in the latter instance, I do not think the global economic background justifies a resumption of bear markets (20% possibility), which were discounting near-depression conditions between 4Q 2008 and 1Q 2009.”
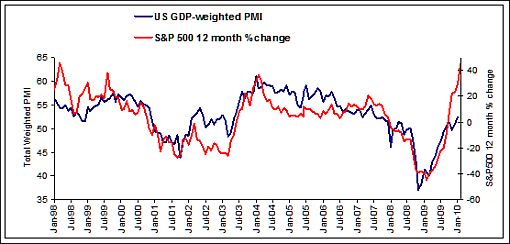
I side with Fuller on his conclusion, but am also cognizant of the 12-month momentum of the S&P 500 narrowly tracking the US GDP-weighted PMI (see graph below). Current levels of the S&P 500 indicate the market is expecting a GDP-weighted PMI in excess of 60.0 vs a current level of 52.3. If the S&P 500 maintains its current levels around 1,100, the 12-month momentum will drop to 39% at the end of March and 27% at the end of April this year. Even this drop in momentum requires the GDP-weighted PMI to rise to 55 and higher. Although not impossible, it seems improbable given the sub-par economic recovery. It can therefore be deduced that the US equity market is somewhat overpriced even if the GDP-weighted PMI should improve to 55. Understandably, Marc Faber suggests (via a Financial Times interview) “investors should make 2010 the year of ‘capital preservation’”.
Source: Plexus Asset Management (based on data from I-Net Bridge).
For more discussion on the economy and financial markets, see my recent posts “Montier: Was it all just a bad dream? Or, ten lessons not learnt“, “Barry Ritholtz sticks with stocks, especially emerging markets“, “Q4 earnings in perspective“, “Face to face with Marc Faber” and “Is the credit malaise really over?” (And do make a point of listening to Donald Coxe’s webcast of February 26, which can be accessed from the sidebar of the Investment Postcards site.)
Twitter and Facebook
I regularly post short comments (maximum 140 characters) on topical economic and market issues, web links and graphs on Twitter. For those readers not doing so already, you can follow my “tweets” by clicking here. You may also consider joining me as a friend on Facebook.
Economy
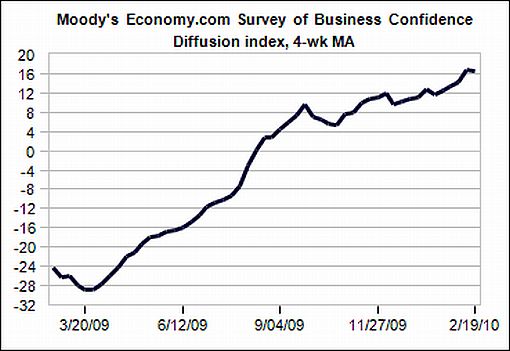
“Business sentiment has improved markedly since hitting bottom about a year ago. This improvement has been about the same across the globe, with South Americans somewhat more optimistic and North Americans somewhat less so,” according to the results of the latest Survey of Business Confidence of the World by Moody’s Economy.com. Businesses are most upbeat when responding to broader questions about current conditions and the outlook into this summer, but remain cautious when responding to specific questions regarding the strength of sales, pricing, inventories and hiring.
Source: Moody’s Economy.com
Meanwhile, the Ifo Business Survey for industry and trade in Germany clouded over somewhat in February. For the first time in ten months, the business climate index has not risen, blaming especially the situation in retailing, which experienced a setback in February. On the whole, the firms have assessed their current business situation somewhat more unfavorably than in the previous month.
Source: Ifo Business Survey, February 23, 2010.
A snapshot of the week’s rather mixed US economic reports is provided below. (Click on the dates to see Northern Trust’s assessment of the various data releases.)
Friday, February 26
• Existing home sales and inventories disappoint
• Minor revisions of Q4 real GDP
Thursday, February 25
• Have durable goods orders and shipments turned the corner?
• Total continuing claims remain at elevated level
Wednesday, February 24
• Chairman Bernanke repeats “Fed fund rate to remain exceptionally low for an extended period”
• Sales of new homes post new record low
• As Greece goes, so goes the US?
Tuesday, February 23
• Consumer confidence slips in February
• Case-Shiller Home Price Index records seventh monthly gain
Monday, February 22
• Fed’s Yellen underscores that removing monetary accommodation now is inappropriate
• Chicago Fed Index advances in January
Referring to Fed Chairman Bernanke’s testimony, Asha Bangalore (Northern Trust) said: “The most important message from Chairman Bernanke’s testimony is that the federal fund rate will be held at 0%-0.25% for an extended period. In light of the higher discount rate (0.75% vs. 0.50%) announced on February 18, 2010, market participants obtained confirmation from the Chairman that the change in the discount rate was a removal of emergency accommodation put in place to address the financial crisis and not a sign of tightening of the monetary policy stance.”
“I don’t think the Fed dares increase the fed fund or policy rate in the face of unemployment at double-digit type of levels. This is more of a technical maneuver,” Bill Gross of Pimco told Reuters (via MoneyNews).
In related news, the Treasury said on Tuesday that it would bolster its Supplementary Financing Program by selling $200 billion in short-term debt and storing the proceeds at the central bank, thereby helping the Fed remove reserves from the financial system.
Summarizing the growth outlook, Bangalore said: “Going forward, the US economy is predicted to show moderate growth in the first three quarters of 2010 and strong growth in the final three months of 2010, with the virtuous cycle of real and financial recovery working together to lift economic growth.”
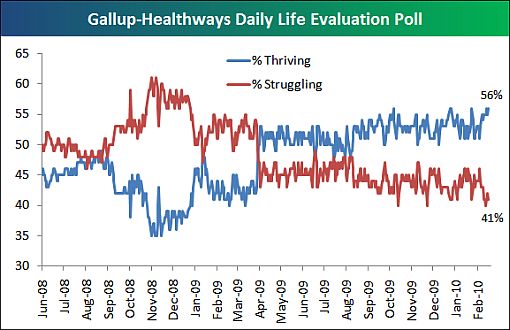
Bespoke highlights a daily Life Evaluation Poll conducted by Gallup.com and Healthways in which participants are asked whether they are “thriving”, “struggling” or “suffering”. As shown below, 56% now say they’re thriving, while 41% say they’re struggling (3% are suffering, which is not shown on the chart). ”These readings are at just about the widest spread we’ve seen since the markets’ recovery began,” remarked Bespoke.
Source: Bespoke, February 26, 2010.
The article continues here
By Dr Prieur du Plessis
Dr Prieur du Plessis is an investment professional with 25 years' experience in investment research and portfolio management.
More than 1200 of his articles on investment-related topics have been published in various regular newspaper, journal and Internet columns (including his blog, Investment Postcards from Cape Town : www.investmentpostcards.com ). He has also published a book, Financial Basics: Investment.
Prieur is chairman and principal shareholder of South African-based Plexus Asset Management , which he founded in 1995. The group conducts investment management, investment consulting, private equity and real estate activities in South Africa and other African countries.
Plexus is the South African partner of John Mauldin , Dallas-based author of the popular Thoughts from the Frontline newsletter, and also has an exclusive licensing agreement with California-based Research Affiliates for managing and distributing its enhanced Fundamental Index™ methodology in the Pan-African area.
Prieur is 53 years old and live with his wife, television producer and presenter Isabel Verwey, and two children in Cape Town , South Africa . His leisure activities include long-distance running, traveling, reading and motor-cycling.
Copyright © 2010 by Prieur du Plessis - All rights reserved.
Disclaimer: The above is a matter of opinion and is not intended as investment advice. Information and analysis above are derived from sources and utilizing methods believed reliable, but we cannot accept responsibility for any trading losses you may incur as a result of this analysis. Do your own due diligence.
Prieur du Plessis Archive |
© 2005-2022 http://www.MarketOracle.co.uk - The Market Oracle is a FREE Daily Financial Markets Analysis & Forecasting online publication.


