


Gold Making Bearish Lower Highs and Lows
Commodities / Gold and Silver 2010 Feb 28, 2010 - 10:09 AM GMTBy: Merv_Burak

 The daily gold trading information still does not give me great confidence that a new bull market is ahead. Lower highs and lower lows has been the pattern these past few months and needs to change.
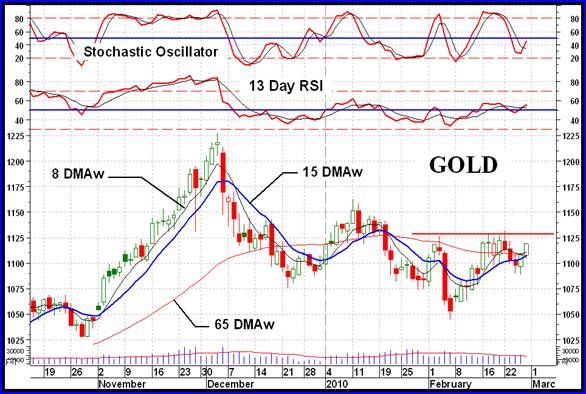
GOLD : LONG TERM
The long term P&F chart is still in a bear mode however the activity over the past few days has given us a new resistance level that once breached would reverse the mode into a bull mode. A move to the $1140 level now would do it. In the mean time, bear is the operational P&F mode.
As for the usual indicators, they are more positive. Gold continues to trade above its positive sloping moving average line. The momentum indicator continues to track inside its positive zone and remains above its positive trigger line. Only the volume indicator is somewhat negative. It is tracking a basic lateral path and is below its still slightly positive trigger line. All in all the rating for the long term remains BULLISH.
INTERMEDIATE TERM
Over the past several weeks gold has established a resistance level at about the $1130 mark and needs to break through that level to show it is on the move. For now it is still some $11 below that level, close but not quite there yet. Gold dropped below its moving average line earlier in the week but closed on Friday above the line. The moving average line itself is still in a downward slope. This would most surely change should the price breach that resistance level. The volume indicator is moving in a sideways path but remains below its negative sloping trigger line. The momentum indicator is just above its neutral line in the positive zone and is above its positive trigger line. The intermediate term rating is BULLISH but we could do with the moving average turning upward. The short term moving average line is just a hair below the intermediate term line and should confirm this bull rating in another day or so.
SHORT TERM
The short term has been bouncing around lately and this week it closed on the positive side. Gold closed the week above its positive short term moving average line. The momentum indicator is back above its neutral line in the positive zone and above its positive trigger line. The daily volume activity is still weak and could do with more enthusiasm from the speculators. The short term is rated as BULLISH. The very short term moving average line remains above the short term line for confirmation of this rating.
The immediate direction of least resistance seems to be to the up side but there is that resistance level at about the $1130 level that may ruin that direction. I’ll go with the up side for now but will watch that resistance level.
SILVER
I keep reading all these articles that silver is the place to be and that it is much more bullish for the future than gold. From time to time I even echo that sentiment based upon technical comparisons. In the end the ACTUAL TRADING in silver tells us what the professionals REALLY think of silver at any period in time. Although silver had a better week than gold it is still in a weaker technical position than gold. The short and intermediate term Relative Strength (RS) for silver in the weekly Table suggests that silver is in the bottom half of all the components in the table as far as performance is concerned. One bright spot is that, although the silver RS is in the bottom half its performance is improving and maybe we will see some change in its performance versus the other Table components soon.
On the long term, silver is below its negative moving average line, the momentum is in its positive zone above a positive trigger line and the volume indicator is still below its negative trigger line. The long term rating is therefore just above a full bear rating at – NEUTRAL.
On the intermediate term, silver is below its negative sloping moving average line, the momentum is below its neutral line in the negative zone but above its positive sloping trigger line and the volume indicator still remains below its negative trigger line. All in all the intermediate term is still fully BEARISH although not too far from improving. The short term moving average line is still some distance from the intermediate term line providing continued confirmation of the bear.
On the short term silver has moved above its short term moving average line and the line is sloping in an upward direction. The momentum indicator has just moved into its positive zone and is above its positive sloping trigger line. The daily volume activity is picking up as the daily silver activity is moving higher. On the short term we are fully BULLISH.
As for the immediate direction of least resistance, that seems to be to the up side.
PRECIOUS METAL STOCKS
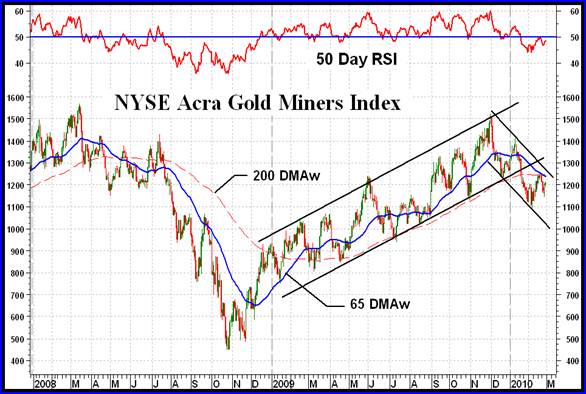
One of this week’s six stocks reviewed in my weekly Stock Review Section of the Subscribers site was Market Vectors Gold Miners ETF (N-GDX). Since that stock is based upon the NYSE Acra Gold Miners Index I thought I’d show that Index this week. The ETF stock price tracks a very similar path to the Index as one would expect although on the short term one can see minor differences in activity. There is always a question when one is interested in an ETF which is based upon an Index. Should one act on the activity in the stock one is interested in or should one base their decision on the activity of the Index since the stock movement is based upon the Index. My own personal view would be to act on the actions of the stock with one important proviso, if the stock price starts to exceed the performance of the Index wait for the two to come back in sync otherwise you may be paying a premium that will vanish.
An interesting point when buying into any ETF that is based upon a basket of component stocks in an Index is that it is important to understand how that basket is used towards the Index calculation. As an example, the above Index has 32 component stocks in its basket. Since the Index calculation is based upon a weighted method three stocks alone represent 40% of the Index while the bottom one third of the stocks only represent 3.3% of the Index. You could have a significant portion of the component stocks of the Index in roaring bull markets but the top three stocks could just keep the Index from showing that performance. This is a problem with investing in ETFs in general.
Overall it was a quiet week in the gold and silver stocks. Most of the stocks in my universe of 160 stocks closed with minor gains or losses. There were only 10 stocks with double digit moves, 7 on the up side and 3 on the down side. Only one stock had a move greater than 30%, one of my guides as to the strength of moves. As a comparison of the 30 stocks in the Penny Arcade Index there were 8 double digit movers, 4 on the up side and 4 on the down side. There were no moves greater than 30% indicating a lazy week in the pennies.
The Merv’s Penny Arcade Index does look like it’s ready for a new upside move. The downside seems to have stabilized but we’ll have to see the new move before we say it’s happening.
Merv’s Precious Metals Indices Table
Well, that will be it for this week.
By Merv Burak, CMT
Hudson Aero/Systems Inc.
Technical Information Group
for Merv's Precious Metals Central
For DAILY Uranium stock commentary and WEEKLY Uranium market update check out my new Technically Uranium with Merv blog at http://techuranium.blogspot.com .
During the day Merv practices his engineering profession as a Consulting Aerospace Engineer. Once the sun goes down and night descends upon the earth Merv dons his other hat as a Chartered Market Technician ( CMT ) and tries to decipher what's going on in the securities markets. As an underground surveyor in the gold mines of Canada 's Northwest Territories in his youth, Merv has a soft spot for the gold industry and has developed several Gold Indices reflecting different aspects of the industry. As a basically lazy individual Merv's driving focus is to KEEP IT SIMPLE .
To find out more about Merv's various Gold Indices and component stocks, please visit http://preciousmetalscentral.com . There you will find samples of the Indices and their component stocks plus other publications of interest to gold investors.
Before you invest, Always check your market timing with a Qualified Professional Market Technician
Merv Burak Archive |
© 2005-2022 http://www.MarketOracle.co.uk - The Market Oracle is a FREE Daily Financial Markets Analysis & Forecasting online publication.