Stock Market Oscillating Between Support and Resistance Before Choosing a Direction
Stock-Markets / Stock Markets 2010 Feb 28, 2010 - 07:52 PM GMTBy: Angelo_Campione
 General Commentary: The system for the SPY is on a Buy signal 50%
As anticipated, the market hit resistance around 1110 and essentially went sideways for the week, so not a lot of change from the prior week.
For the week ahead, we'll probably get more oscillating action between 1090 and 1110 before a direction is chosen. At this stage, the direction for March could go either way, although we are leaning on the bullish side at this point.
I know it's somewhat surprising to be leaning on the bullish side when the general fundamentals of not only the US but also the European economies seem dubious. However all markets go through cycles and the messages we receive through the media often doesn't match up with these underlying cycles.
What the media doesn't report is that there's a huge flow on effect from all the stimulus initiatives implemented by governments worldwide. So for the medium term, this cash is flowing into company bottom lines and encouraging everyone concerned.
Logically, I think we all know that a price will need to be paid at some point for simply printing money as a solution to the issues but often logic is overlooked when survival is in doubt.
SPX Chart - Much Bigger Picture
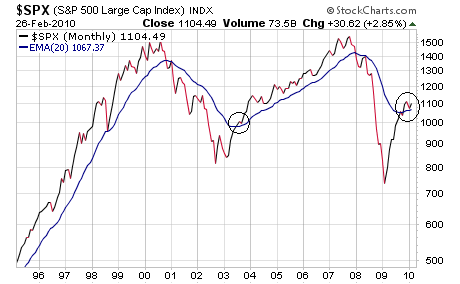
Here's a chart I like to show at the end of the month to see how the much bigger picture is looking.
The market closed on Friday above the 20 month EMA and so we remain in a new bull market phase (for the new readers, the 20 month EMA is a simple indicator to determine a bigger picture bull or bear market)
At this point, we continue to resemble the mid 2003 period. As long as the market finishes each month above the 20 month EMA, we have to concede that we're in the beginning stages of new big bull.
SPX Chart - Bigger Picture
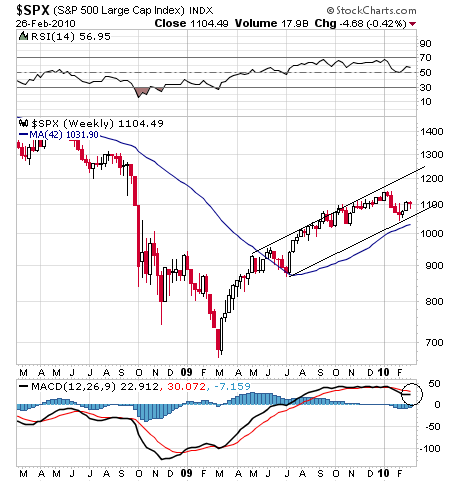
For the mid term, there's no change, the uptrend remains in tact.
The linear MACD also has the potential to cross back into positive territory from here.
SPX Chart - Shorter Picture
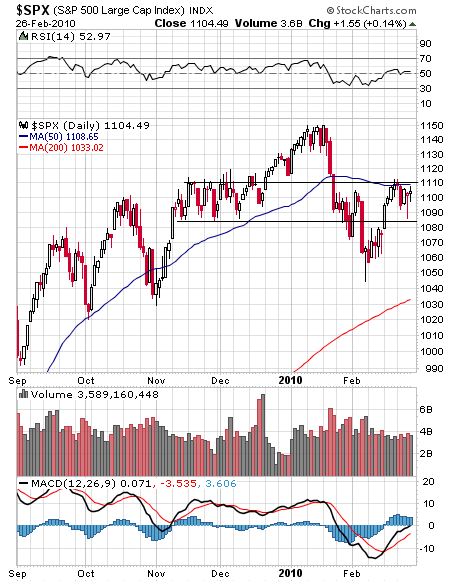
The shorter term shows how the market met resistance at both the 50 DMA and the trading range from mid November to early December.
The likelihood is that we get more range bound trading around this area. Any dip into the 1070 - 1080 region still looks like a reasonable place to initiate a long position.
For the week ahead, support on the SPX is 1070 - 1080 and resistance is 1110 - 1120.
The VIX Picture
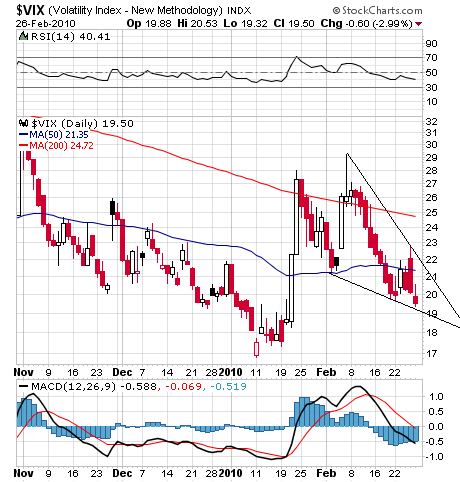
The VIX is interesting here, while we got a close below 20 (indicating that complacency is setting in again), we could be seeing a bullish wedge develop.
If the market does go sideways this coming week, we're likely to see the VIX fill in the wedge pattern drawn on the chart.
The VIX measures the premiums investors are willing to pay for option contracts and is essentially a measure of fear i.e. the higher the VIX, the higher the fear in the market place. It tends to move inversely with the markets.
Performance
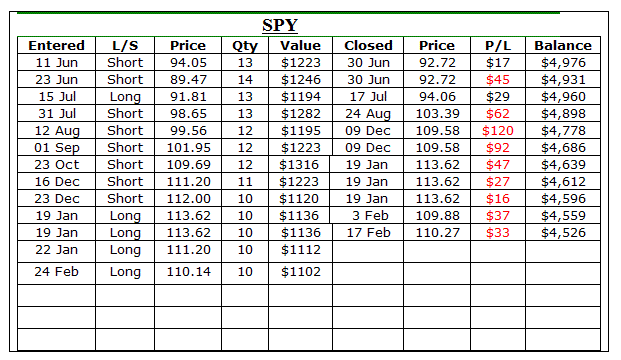
We're using a starting capital of $5,000 and allocations are based on 25% of this or the remaining balance.
Feel free to email me at angelo@stockbarometer.com if you have any questions or comments.
If you are receiving these alerts on a free trial, you have access to all of our previous articles and recommendations by clicking here. If you do not recall your username and/or password, please email us at customersupport@stockbarometer.com. If you are interested in continuing to receive our service after your free trial, please click here.
By Angelo Campione
Important Disclosure
Futures, Options, Mutual Fund, ETF and Equity trading have large potential rewards, but also large potential risk. You must be aware of the risks and be willing to accept them in order to invest in these markets. Don't trade with money you can't afford to lose. This is neither a solicitation nor an offer to buy/sell Futures, Options, Mutual Funds or Equities. No representation is being made that any account will or is likely to achieve profits or losses similar to those discussed on this Web site. The past performance of any trading system or methodology is not necessarily indicative of future results.
Performance results are hypothetical. Hypothetical or simulated performance results have certain inherent limitations. Unlike an actual performance record, simulated results do not represent actual trading. Also, since the trades have not actually been executed, the results may have under- or over-compensated for the impact, if any, of certain market factors, such as a lack of liquidity. Simulated trading programs in general are also subject to the fact that they are designed with the benefit of hindsight. No representation is being made that any account will or is likely to achieve profits or losses similar to those shown.
Investment Research Group and all individuals affiliated with Investment Research Group assume no responsibilities for your trading and investment results.
Investment Research Group (IRG), as a publisher of a financial newsletter of general and regular circulation, cannot tender individual investment advice. Only a registered broker or investment adviser may advise you individually on the suitability and performance of your portfolio or specific investments.
In making any investment decision, you will rely solely on your own review and examination of the fact and records relating to such investments. Past performance of our recommendations is not an indication of future performance. The publisher shall have no liability of whatever nature in respect of any claims, damages, loss, or expense arising out of or in connection with the reliance by you on the contents of our Web site, any promotion, published material, alert, or update.
For a complete understanding of the risks associated with trading, see our Risk Disclosure.
© 2010 Copyright Angelo Campione - All Rights Reserved
Disclaimer: The above is a matter of opinion provided for general information purposes only and is not intended as investment advice. Information and analysis above are derived from sources and utilising methods believed to be reliable, but we cannot accept responsibility for any losses you may incur as a result of this analysis. Individuals should consult with their personal financial advisors.
© 2005-2022 http://www.MarketOracle.co.uk - The Market Oracle is a FREE Daily Financial Markets Analysis & Forecasting online publication.


