The “Plunge Protection Team” Working Overtime to Save US Stock Market
Stock-Markets / Market Manipulation Aug 09, 2007 - 11:34 AM GMTBy: Gary_Dorsch
“Imagination is more important than knowledge”, the brilliant Albert Einstein used to say. Imagine for just a moment, that the Dow Jones Industrials has become a key instrument of national economic policy, and that by “actively managing” its direction, the government could impact the wealth of tens of millions of US households, and by extension, influence consumer confidence and spending.
Since the appointment of Henry Paulson to the helm at the US Treasury, the US stock market has always found a way to defy the law of gravity. During Paulson's short reign, the Dow Jones Industrials (DJI-30) broke an 80-year old record for the longest streak of gains with only three declining days in between. During the first seven months of his tenure, the S&P 500 did not decline by 2%, the second longest-period without a 2% correction since 1964.
The market savvy Treasury chief, who built a $730 million fortune at Goldman Sachs, is also the chairman of the Working Group on Financial Markets, commonly known as the Plunge Protection Team (PPT), created by Ronald Reagan to prevent a repeat of the Wall Street meltdown in October 1987. The PPT is empowered to intervene in stock index futures and the foreign currency markets in the event of a crash.
Paulson and his Plunge Protection Team are dealing with another tough challenge, trying to extend the S&P 500's all-time record for avoiding a 10% correction. It's been 52-months since the S&P 500's last slide of 10% or more, which took place from January 14 to March 11, 2003, when it lost 14 percent. Since then, the benchmark index has more than doubled without a similar drop.
“It's my job to be vigilant,” Paulson said on July 26th. “I've made this statement when the markets looked very good, and I've made it during times of volatility, but I will say that on global financial shocks, it's very hard to predict them. I am comforted by the fact that we have a strong global economy and very healthy economy in the US, but it's my job to be vigilant," Paulson said.
Federal Reserve chief Ben “helicopter” Bernanke is the US Treasury chief's right hand man, a key player controlling the US money supply. Since Paulsen's confirmation in July 2006, the broad M3 money supply has expanded at a 13% annualized clip, its fastest in 30-years, in a brazen effort to inflate the US stock markets, and keep the cost of borrowing low for corporate takeover artists.
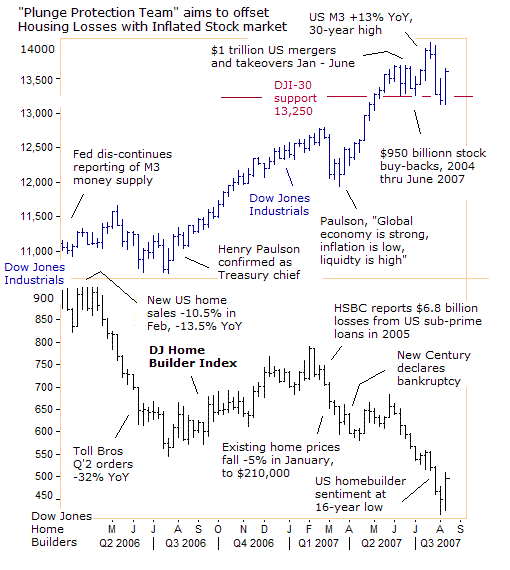
The PPT's strategy is to offset weakness in the US housing market, with increased household wealth in the stock market, in order to avoid a recession. However, the weakness in housing has gone on longer and deeper than the PPT would like. Existing US single-family homes marked their eighteenth consecutive monthly price decline in May, bringing the annual loss to 3.4 percent.
US homebuilder sentiment slid in July to its lowest since January 1991, the National Association of Home Builders said on July 17th, as fallout from the housing slump and sub-prime mortgage crisis caused a glut of new homes. US home foreclosure filings rose 58% in the first six months of the year and could surpass 2 million this year as the housing market continues to deteriorate, RealtyTrac, said on July 30th.
The escalating foreclosure rate on US homes has badly shaken the $2 trillion sub-prime mortgage market, and the riskiest BBB- segment, has lost 65% of its market value to 35-cents on the dollar. The sudden aversion for risk spilled over into the high-yield junk bond market, where yields jumped 120 basis points, putting speculators on edge about the outlook for corporate takeovers and share buybacks, the two key catalysts of the market's rally to record highs.
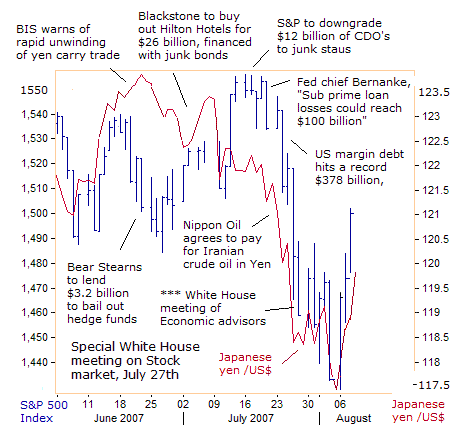
The US junk bond market lost another source of liquidity, via the “yen carry” trade, after the dollar tumbled from 124-yen in June to as low as 118-yen. It was against this backdrop, that the skittish S&P 500 retreated 1.8% to close at 1,433 on August 3rd, bringing its string of losses since July 13th to 7.7%, it's third largest since May-June 2006, when it fell 8%, and from March 2004 to August 2004, when it fell by 8.7%. The fickle stock market switched its focus away from second-quarter profit growth of 11% for the S&P 500, or 2.5 times more than estimated in June.
But the PPT cannot afford to sit back and watch both the US housing market and the stock market sinking at the same time. That might spell the dreaded “R” word, - Recession. Recognizing the huge risks to the US economy, President Bush called for a special meeting of his economic advisors on July 27th, to discuss the stock market, which had plunged as much as 456-points the previous day.
Speaking from the Roosevelt Room, just 20-minutes after the opening bell of the NYSE on July 27th, President Bush said the US and world economy were strong after American gross domestic product jumped 3.4% in the second quarter. “The world economy is strong and I happen to believe one of the main reasons why is because we remain strong. The US economy is large, flexible and resilient.

Before his meeting with Bush, PPT chief Paulson spoke about the 381-point plunge of the Dow Jones Industrials on July 26th. “We're always going to have volatility. What we see going on right now is risk being re-priced and as we get a broad reassessment of risk we're getting volatility. We've had volatility as long as I've watched the markets,” he added. Did President Bush give the “Plunge Protection Team” the green light to intervene in the marketplace to prevent a stock market crash on July 27th?
After another volatile trading session on July 31st, when the Dow Jones Industrials gyrated within a 300-point range, from its early morning high of 13,500 to close sharply lower at its worst level at 13,185, PPT skeptics were asking, “Where is the mythical PPT now, with the stock market is teetering on the verge of collapse?
Just 24-hours earlier, shares of American Home Mortgage AHM.N, had plunged 87% to $1 per share, after the mortgage lender said it was unable to fund home loans and would have to liquidate its assets. The company commanded a 2.5% share of the US mortgage market, and specialized in prime and near-prime loans, otherwise known as Alt-A loans, which are now trading close to 63 cents on the dollar. The meltdown in AHM.N shares was largely blamed for the DJI's 240-point plunge on July 31st.
Later that evening, Dow Jones Industrial futures were unusually volatile during Asian trading hours, extending their losses by 110-points, and the US dollar slumped to as low as 117.60-yen. The next morning, the US government reported that crude oil stocks had declined by 6.5 million barrels to 344.5 million, and Venezuela's mercurial kingpin Hugo Chavez was loudly telling his audience in Caracas, that “crude oil prices were headed straight to $100 per barrel.”
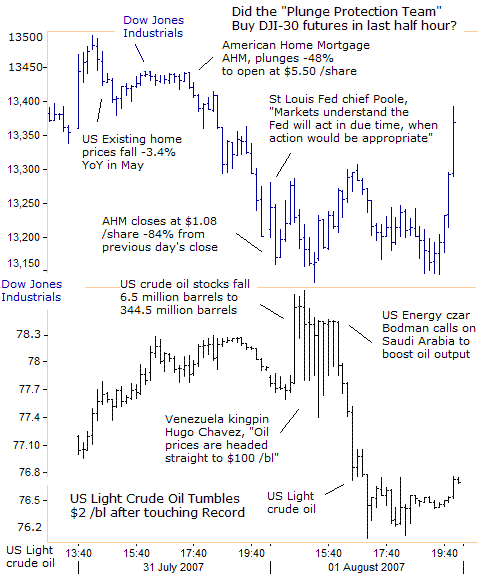
US light crude oil briefly shot-up to a new record high of $78.77 per barrel, and the DJI-30 sank further to 13,150. It was looking pretty grim for Wall Street bulls, with PPT chief Paulson, situated far away in Beijing, trying to head-off a trade war between the US Congress and China next year. And when the cat's away, the mice will play. Was the mythical PPT was asleep at the switch while Wall Street burned?
But then it happened! At around 3:20 pm EST on August 1st, the DJI-30 began to move up strongly and without hesitation. By the closing bell at 4:00 pm, the DJI-30 had skyrocketed by 230-points above its lows, to close 150-points higher on the day. The mainstream media pointed to the possibility of computer buy programs, which kicked into high gear, after the S&P 500 held above its 200-day moving average.
Did the Plunge Protection Team enter the marketplace in the final half-hour of August 1st to prevent the DJI-30 and S&P 500 from closing below key technical support levels? A former Federal Reserve member once suggested that “instead of flooding the entire economy with liquidity, and thereby increasing the risk of inflation, the Fed could support the stock market directly by buying market averages in the futures market, thus stabilizing the market as a whole.”
However, PPT skeptics could argue that the 230-point surge for the DJI-30 in the last half hour of trading on August 1st was a delayed reaction to an earlier $2.50 per barrel plunge in crude oil to $76.20 /barrel. US Energy czar Samuel Bodman was “jawboning” OPEC, and publicly called on the oil cartel to open its spigots wider, to cap the price of oil, and move the US economy away from the danger zone.
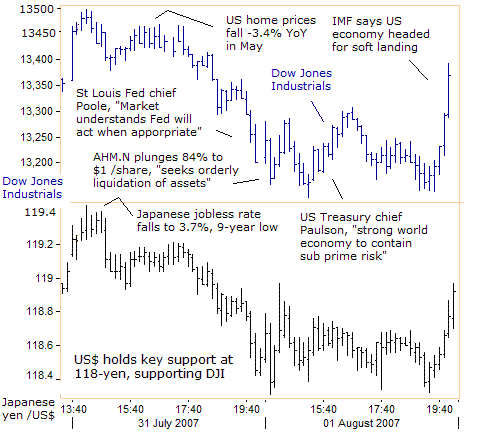
Also in the background, the US dollar was building a “triple bottom” on the hourly charts at 118.40-yen, which meant the “yen carry” trade was down but not out. The late surge in the DJI-30 was enough to persuade currency traders to bid the dollar to 119-yen, which in turn, was enough to scare over zealous DJI-30 bears out of short futures positions, and pushed the stock market higher.
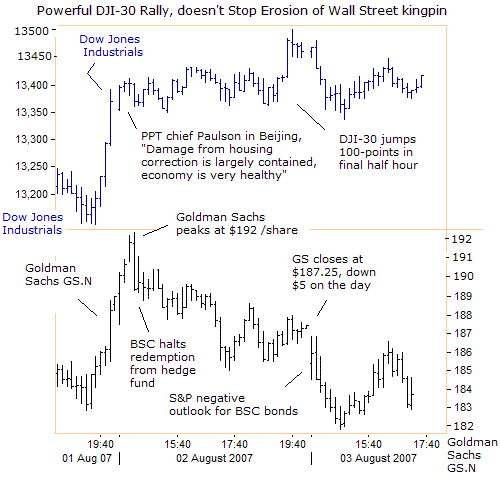
The following day, the DJI-30 held onto its late 230-point advance, see-sawing in a tight sideways range, and keeping short sellers in a hammer lock. Not knowing who delivered the late knock-out punch on August 1st, several short sellers folded their cards in the final half-hour, lifting the DJI-30 by 100-points to the 13,500 area. Yet during the trading session, the strength of the DJI-30 couldn't mask the underlying erosion in Wall Street power brokers, such as kingpin Goldman Sachs.
Goldman Sachs was swept lower by Bear Stearns, whose shares melted down by 25% since July 18th, after two of its hedge funds that bet heavily on risky sub-prime loans had dropped to 9-cents on the dollar. Traders are also nervous about investment banks that have underwritten $300 billion of high yield junk bonds that are unlikely to clear the market at a price they were bought at.
However, the PPT wouldn't stand idle and allow the panic swirling around the Wall Street power brokers to turn into a crisis. “The market understands, that the Fed will act in due time, if and when evidence accumulates that action would be appropriate,” said St Louis Fed chief William Poole on July 31st.
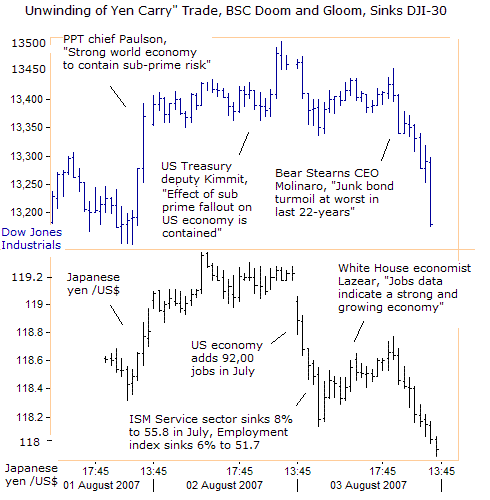
On the morning of August 3rd, the PPT was faced with a renewed assault on the stock market, when US dollar plunged 1-yen to as low as 118.20-yen in the first hour of New York trading, following a weak US jobs report in July. Traders reacted more severely to the private ISM Service sector index, which fell 8% in July, and tracks 85% of the US economy. ISM's service sector employment index fell 6% to the 51.7 level, dangerously close to stagnant job growth.
PPT spin-meisters began twirling the data. On August 3rd, the White House's top economic adviser Edward Lazear said, “Job growth continues, even in a period when we are seeing changes in the US economy, most of which were positive,” after data showed 92,000 new US jobs were created in July, the slowest in two years. But there is still much skepticism over the reliability of the employment figures.
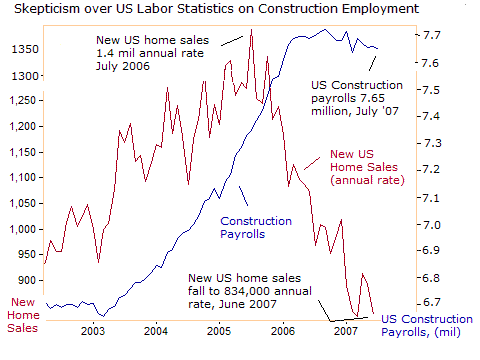
Traders are puzzled over why the US Bureau of Labor Statistics has shown no change in the number of construction jobs from eighteen months ago, even though homebuilding activity has dropped dramatically. Sales of new homes in the US have tumbled 40% to annual rate of 834,000 from their peak, and are down 22.3% compared with June 2006. The sales pace in June and March was the lowest since 1999. Are homebuilders employing thousands of idle workers, to help the broad economy?
An alternative estimate, based on data used to develop the ADP National Employment Report, suggests that employment in the construction industry has already declined 156,000 from a recent peak, and is now 139,000 below the government's official estimates. ADP suggests that the construction sector will shed as many as 247,000 jobs thru the end of 2008, or about 14,000 per month.
Then dire comments by Bear Stearns Chief Financial Officer Sam Molinaro at 2:30 pm EST on August 3rd, unraveled the PPT's hard work. “The fixed income market environment we've seen in the last eight weeks has been pretty extreme, and is comparable to market events that include the debt crisis of the late 1990's,” he said.
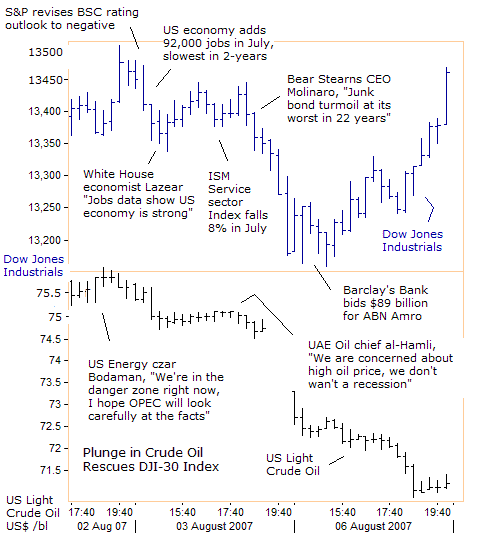
Molinaro's confession left the Dow Jones Industrials in a shambles with a 281-point loss on August 3rd, closing below horizontal support at the 13,250 level, and knocked the S&P 500 below its 200-day moving average. DJI-30 futures extended their losses by 50-points on Sunday night, during Asian trading hours, when the dollar fell to 117.10-yen. But Nikkei-225 futures and DJI-30 futures recovered their losses when the dollar bounced back above 118.00-yen in London.
The PPT got a timely gift, when Barclays Bank formally launched its 65 billion euro ($89 billion) bid for ABN AMRO, on August 6th, in an attempt to beat a Royal Bank of Scotland-led consortium, in the biggest ever bank takeover. Pulling another rabbit out of the hat, US light crude oil opened $2 per barrel lower on the NYMEX, and extended its daily loss to 5%, igniting a 286-point DJI-30 rally, its best daily performance in five years.
On August 3rd, US Energy czar Sam Bodman had loudly voiced concern the US economy was “in the danger zone” and would suffer if oil prices did not fall soon. “We are going to need more oil and I'm hopeful that the OPEC ministers at their Sept 11th meeting will agree to that. I am concerned that we are operating in the ranges approaching $80 per barrel,” Bodman said.

An hour later, the UAE's oil chief Mohammed al-Hamli, signaled a possible increase in OPEC oil production next month. “We are concerned about the higher price, because we don't want to go through a recession,” he said, quickly knocking $2 a barrel off crude prices. Expectations of an OPEC decision in September to pump more oil has already flushed out bullish speculators, and shaved about 8% off the peak oil price set on July 31st.
There's a good chance Riyadh might heed the call for more oil, after the Bush administration said it will ask the US Congress to approve an arms-sale package to Saudi Arabia, the United Arab Emirates, Kuwait, Qatar, Bahrain and Oman, that may total more than $20 billion. The package includes advanced satellite-guided bombs, fighter-aircraft upgrades and new naval vessels. Bush wants to lock in the 10-year deal for the US military-industrial complex, before he leaves office.

OPEC has already boosted its oil output by 250,000 bpd since April to 26.75 mil bpd today. In a surprising move on August 6th, Saudi Arabia lowered the price for its best blend, Extra Light crude by $4 per barrel to US customers. Still, Riyadh may wait for confirmation that the president's “Arms for Oil” deal can pass through the Democratic led US Congress, before committing to a formal increase in oil output in September. So far OPEC “jawboning” has done the trick of knocking crude oil off its all-time highs.
The DJI-30's powerful rallies on August 1st and August 6th might have been linked to expectations of sharply lower oil prices. That would be a replay of July 2006, the last time crude oil topped out at $78 per barrel, before an extended slide of $28 per barrel to $50 /barrel, and helped jettison the Dow Industrials 10% higher, while keeping Treasury bond yields low.
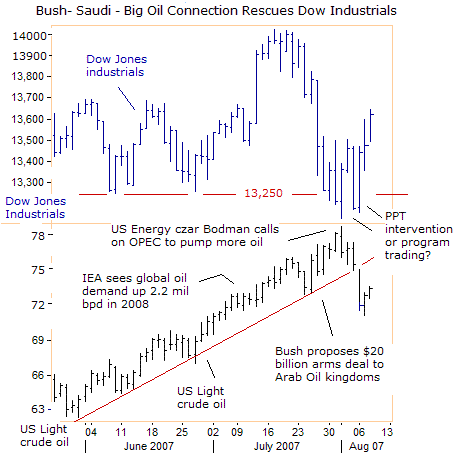
If one suspects the DJI-30's powerful 550-point rally from the August 6th low to the August 8th high was fueled in part by the 8% slide in crude oil prices, how does one explain how Exxon Mobil, led the DJI-30 rally, climbing 10% to as high as $87.90 /share. Similarly, the S&P Energy Spider-XLE, rebounded by 7% above its early August 6th low, tracking the DJI-30 higher.
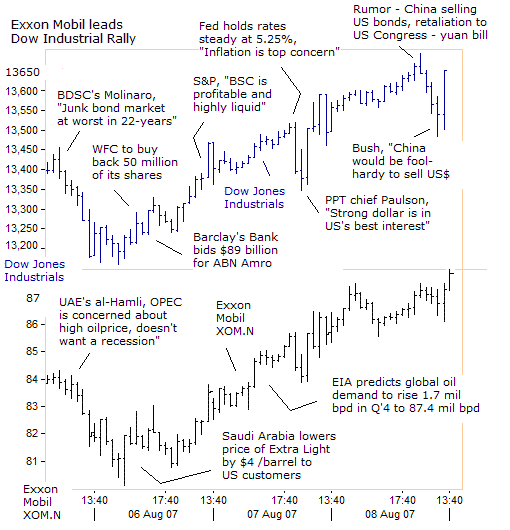
On August 7th, the Federal Reserve held the fed funds rate steady at 5.25%, despite downside risks to the US economy from the sub-prime mortgage meltdown and frozen junk bond market. The Fed's hands are tied right now, because rate cuts could hammer the US dollar. “The Committee's predominant policy concern remains the risk that inflation will fail to moderate as expected. High levels of resource utilization can sustain inflationary pressures,” the Fed said.
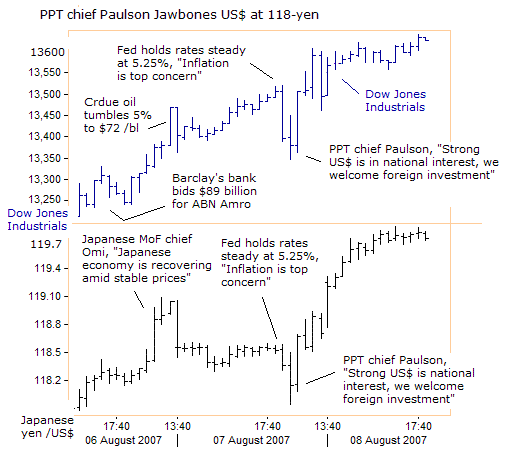
The knee-jerk reaction to the Fed's statement was bearish. The DJI-30 quickly lost 150-points in 20-minutes to as low as 13,350. The initial interpretation of the Fed's statement meant the central bank could not ease the plight of Wall Street power brokers by pumping dollars into the money markets. Yen carry traders panicked, when the Fed said “downside risks to economic growth have increased”, and quickly dumped the dollar to as low as 118-yen.
But the carnage came to an abrupt halt, when PPT chief Paulson said “a strong dollar is in the nation's best interest. We welcome foreign investment.” Within a half-hour of Paulson's comments, the US dollar jumped 0.90-yen to 118.90-yen, and the Dow Jones Industrials skyrocketed 250-points in a flash. With the Fed ruling out rate cuts in August and September, “yen carry” traders figured it was safe to dive back into the DJI-30, especially after Paulson's wink and nod
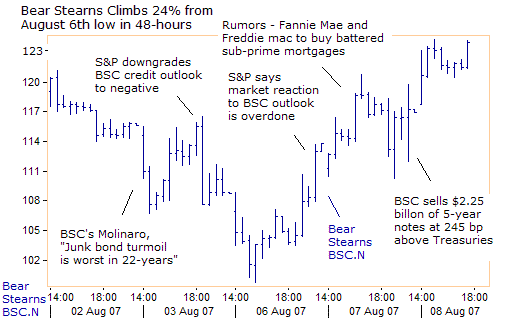
The US stock market got a big shot of adrenalin, when Bear Stearns (BSC.N) rose 24% above its August 8th low, within the span of 48-hours. On August 3rd, Standard and Poor's had lowered its outlook on Bear to negative, which prompted BSC's stock price to plunge by 14% to as low as $99.75 /share. Then on August 6th, S&P said market's bearish response was a “vast overreaction. We still expect the company to be profitable in the current quarter and thereafter. Its liquidity is strong,” S&P said.
Later on, the media began to sprinkle rumors that Fannie Mae and Freddie Mac were seeking authority to bid for badly battered sub-prime mortgage debt, a quasi government bail out of Wall Street power brokers. Jigging the market higher, Wells Fargo announced the buyback of another 50 million shares, while Merrill Lynch's stock was upgraded by fellow banker UBS, which said the stock's beaten down price already reflects risks the company faces in the sub-prime mortgage market.
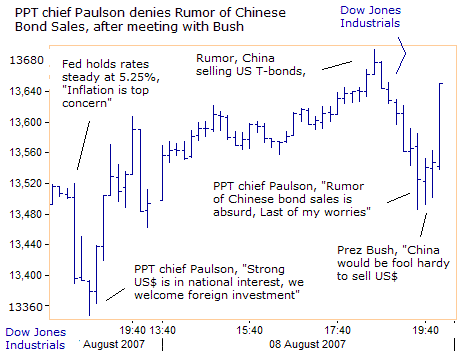
On August 8th, the DJI-30 was humming on all cylinders, up 550-points above its August 6th low, reaching 13,700, before word spread that Bush was holding a important meeting with PPT chief Paulson at the Treasury department, amid talk that China was dumping US bonds, in retaliation to US sanctions aimed at the yuan. The DJI-30 plunged 200-points over the next hour.
PPT chief Paulson spoke to reporters to extinguish the rumors. “I think it's absurd, frankly. What the Chinese hold in Treasuries is less than one day's trading volume in Treasuries. We have a broad, liquid market. If you've got a hundred things to worry about, I'd worry about that last,” he said. Bush told Fox News Channel's Neil Cavuto, “It would be foolhardy for China to sell US dollar assets”
Soon after remarks by Bush and Paulson, the DJI-30 soared 150-points, “micromanaging” the market on every significant pullback or downturn. Nowadays, “Investing” in the stock market seems like a crap shoot, rolling the dice on the next piece of “hot news” to roll across the computer screen.
Is the “Plunge Protection Team,” Myth or Reality?
Is the legendary PPT just a myth, conjured up by a bunch of conspiratorial nuts? Former president Clinton advisor, George Stephanopoulos told “Good Morning America” on Sept 17, 2001, “There are various efforts going on in public and behind the scenes by the Fed and other government officials to guard against a free-fall in the market, what is called the “Plunge Protection Team.”
“The Federal Reserve, big major banks, representatives of the New York Stock Exchange and the other exchanges have an informal agreement to come in and start to buy stock if there appears to be a problem. They acted more formally in 1998, during the Long term Capital Crisis, and propped up the currency markets. And, they have plans in place if the markets start to fall.”
On August 8th, 2007, President Bush hinted at government intervention in the US stock market. “Treasury secretary Paulson and his advisors are paying close attention, as the market begins to readjust its assessment of risks and are watchful for any downturn,” he said. “There is a lot of liquidity in our system and liquidity will provide the capacity for our system to adjust,” Bush added, alluding to the Fed's tolerance of double digit M3 money supply growth.
The big question is whether US Treasury chief Henry Paulson and Fed chief Bernanke are pursuing a more active interventionist policy than what was originally mandated for the PPT? The turnover of interest rate, currency and stock index derivatives rose 24% to $533 trillion in the first quarter, and that's a big time bomb that can blow-up at anytime. It requires constant surveillance and “vigilance” over the world's greatest casinos. Warren Buffett calls derivatives “weapons of mass destruction.”
If correct, then the PPT is “watching the markets closely”, (Japanese code words for intervention) and Paulson and Bernanke aim to prevent a 10% correction at all costs. There are glaring signals in the marketplace that indicate when the PPT appears to be intervening in stock index futures, and these signals were revealed in the August 3rd edition of Global Money Trends, with plenty of cool charts. If you expand your imagination, as Einstein suggests, and accept the notion that the PPT is “managing the markets,” you might become more successful in trading.
The Global Money Trends newsletter provides insights and analysis on the global commodity, currency, and bond and stock markets that are not found in the mainstream media, to help readers make better investment decisions. Each edition contains lots of cool charts, and is published 44 times per year on Friday's, with special alerts when unexpected events unfold.
By Gary Dorsch,
Editor, Global Money Trends newsletter
http://www.sirchartsalot.com
This article is just the Tip of the Iceberg, of what’s available in the Global Money Trends newsletter! Here's what you will receive with a subscription, Insightful analysis and predictions for the (1) top dozen stock markets around the world, Exchange Traded Funds, and US home-builder indexes (2) Commodities such as crude oil, copper, gold, silver, the DJ Commodity Index, and gold mining and oil company indexes (3) Foreign currencies such as, the Australian dollar, British pound, Euro, Japanese yen, and Canadian dollar (4) Libor interest rates, global bond markets and central bank monetary policies, (5) Central banker "Jawboning" and Intervention techniques that move markets.
GMT filters important news and information into (1) bullet-point, easy to understand analysis, (2) featuring "Inter-Market Technical Analysis" that visually displays the dynamic inter-relationships between foreign currencies, commodities, interest rates and the stock markets from a dozen key countries around the world. Also included are (3) charts of key economic statistics of foreign countries that move markets.
A subscription to Global Money Trends is offered at only $150 US dollars per year for “44 weekly issues”, including access to all back issues. Click on the following hyperlink, to order now, http://www.sirchartsalot.com/newsletters.php Call toll free from USA to order, Sunday thru Thursday, 2 am to 4 pm EST, at 866-576-7872.
Mr Dorsch worked on the trading floor of the Chicago Mercantile Exchange for nine years as the chief Financial Futures Analyst for three clearing firms, Oppenheimer Rouse Futures Inc, GH Miller and Company, and a commodity fund at the LNS Financial Group.
As a transactional broker for Charles Schwab's Global Investment Services department, Mr Dorsch handled thousands of customer trades in 45 stock exchanges around the world, including Australia, Canada, Japan, Hong Kong, the Euro zone, London, Toronto, South Africa, Mexico, and New Zealand, and Canadian oil trusts, ADR's and Exchange Traded Funds.
He wrote a weekly newsletter from 2000 thru September 2005 called, "Foreign Currency Trends" for Charles Schwab's Global Investment department, featuring inter-market technical analysis, to understand the dynamic inter-relationships between the foreign exchange, global bond and stock markets, and key industrial commodities.
Copyright © 2005-2007 SirChartsAlot, Inc. All rights reserved.
Disclaimer: SirChartsAlot.com's analysis and insights are based upon data gathered by it from various sources believed to be reliable, complete and accurate. However, no guarantee is made by SirChartsAlot.com as to the reliability, completeness and accuracy of the data so analyzed. SirChartsAlot.com is in the business of gathering information, analyzing it and disseminating the analysis for informational and educational purposes only. SirChartsAlot.com attempts to analyze trends, not make recommendations. All statements and expressions are the opinion of SirChartsAlot.com and are not meant to be investment advice or solicitation or recommendation to establish market positions. Our opinions are subject to change without notice. SirChartsAlot.com strongly advises readers to conduct thorough research relevant to decisions and verify facts from various independent sources.
© 2005-2022 http://www.MarketOracle.co.uk - The Market Oracle is a FREE Daily Financial Markets Analysis & Forecasting online publication.


