


Stock Market Rally Optical Illusions, “Oil Shocks,” and China’s Headache
Stock-Markets / Financial Markets 2010 Mar 11, 2010 - 12:21 PM GMTBy: Gary_Dorsch

 March 9th, marked the one-year anniversary of the elusive bottom of the most brutal bear market since the 1930’s. At the time, job losses were running in excess of 700,000 /month, and fear was rife that the US-banking system was on the verge of being nationalized. American factories and miners were using 68% of industrial capacity, the lowest level since records began in 1948. Corporate profits fell sharply for the seventh consecutive quarter, the longest losing streak since the 1930’s. The second coming of the “Great Depression” looked imminent.
In a final act of desperation to stop the carnage, the infamous “Plunge Protection Team,” (PPT) unleashed the most powerful weapons in its arsenal, resorting to accounting gimmickry, and nuclear-QE, - injecting $1.75-trillion into the coffers of the Wall Street Oligarchs, in order to turn the bearish tide. Bankers were set free of mark-to-market accounting, and instead, were allowed to value their toxic assets at “mark-to-make-believe” prices, leading to a strong recovery in the financial sector.
Over the course of the next four-weeks, the Dow Jones Industrials climbed 1,500-points to close at 8,083 on April 9th, 2009. Still, there was great skepticism about the sustainability of the so-called “green-shoots” rally, - the third such rally since the horrific crash of Sept-October 2008 that followed the default of Lehman Brothers and the bailout of American International Group (AIG).
Before hitting the ultimate bottom at 6,500, previous Dow rallies ended-up as “bear traps,” that fizzled out, before the market turned sharply lower again. There was a 1,500-point run-up during the week that culminated in the election of Barack Obama as US president, after which the Dow lost 2,000-points over the next-three weeks. The Dow Industrials staged another 1,500-point gain in December, triggered by Obama’s selection of Wall Street favorite Timothy Geithner as Treasury chief, before plunging 2,500-points during the first two-months of 2009.
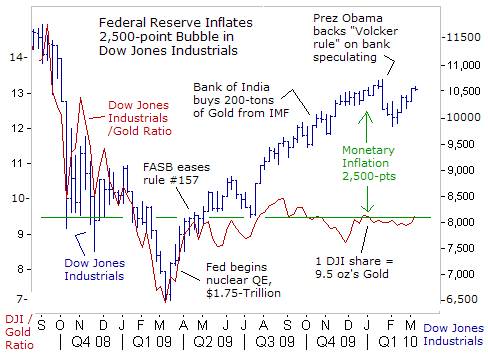
However, since the Dow Industrials hit rock-bottom, US-stocks have staged a $5.3-trillion recovery, amid the biggest percentage gain since the Great Depression. Yet when viewed through the prism of Gold, measured in “hard money” terms, one can see that the performance of the Dow Jones Industrials was less than stellar. The blue-chip indicator has been locked within a narrow trading band for the past 11-months, fluctuating on both sides of 9.5-ounces of gold since April 2009.
The “green shoots” rally is therefore, an Optical Illusion, simply reflecting the side-effects of the Fed’s hallucinogenic “quantitative easing” QE-drug. Utilizing the chart above, one could argue that the value of the Dow Industrials is artificially inflated by about 2,500-points, engineered by the Fed’s monetization scheme, and ultra-low interest rates. An ocean of liquidity is buoying the Dow Industrials above the 10,000-level, designed by the PPT to bolster household confidence, since the valuations of 401-k’s and investor portfolios can influence the propensity to spend.
Still, there are huge worries about unrelenting job losses, multi-trillion dollar budget deficits for years to come, and the “Volcker rule,” which could put the shackles on the Wall Street’s Oligarchs, and force the liquidation of widely held stocks and commodities. But for now, the market’s climb above the 10,000-level, means the possibility of a “double-dip” recession is more remote, and instead, trying to short-sell stock indexes, is like trying to push a helium balloon under water.
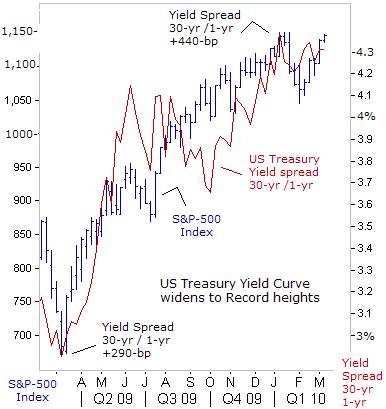
The S&P-500 Index has rocketed +62% higher over the past year, a gain that would normally take five-years to realize. The speed and strength of the stock market’s recovery caught many bond traders off-guard, and knocked US-Treasuries for their worst annual losses since 1978. Most notably, the yield curve, - the spread between short-term interest rates and government bond yields, rose to its widest level ever. The yield on the Treasury’s 30-year bond compared to the one-year T-bill rate hit +440-basis points in December, the widest in history.
Traders reckon that the size of the US-national debt, now exceeding $12.3-trillion, is weighing on bond prices, and a huge avalanche of debt still lies ahead. The Treasury is expected to issue $1.6-trillion in new debt in 2010, and $1.3-trillion the following year. Chinese central banker Zhu Min has warned it would become more difficult for foreigners to buy Treasuries, when the US-government has to fund its deficit by printing more dollars. China slashed its holdings of Treasury securities by $34.2-billion in December, after months of complaining about the Fed’s QE scheme.
The extreme widening of the yield curve also reflects expectations that in the next phase of the Fed’s interest rate cycle, the central bank would be lifting short-term interest rates to contain an outbreak of inflation. “When you have zero rates that go on indefinitely, you are inviting future problems,” warned Kansas City Fed chief Hoenig on March 2nd. “Maintaining excessively low interest rates for a lengthy period runs the risk of creating new kinds of asset misallocations, more volatile and higher long-run inflation,” Honeig said on Jan 7th.
However, the Fed is sending multiple messages to the media, that it’s determined to hold the fed funds rate steady at 0.25% through the remainder of this year. “Even though the recession appears to be over, it does not mean that we are where we want to be. Even with my moderate growth forecast, the economy will be operating well below its potential for several years,” said San Francisco Fed chief Janet Yellen on Feb 22nd. “If it were positive to take interest rates into negative territory I would be voting for that,” she told reporters.
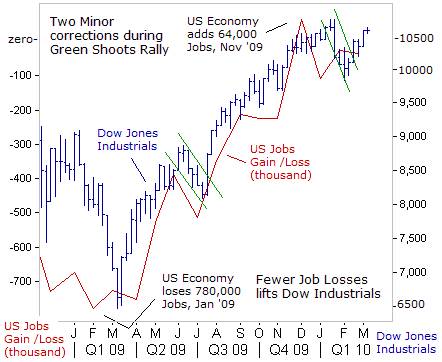
The Obama administration hailed the latest employment report, which showed a smaller-than expected loss of 36,000-jobs, the 25th monthly decline in net jobs in the last 26-months, and January’s official jobless rate of 9.7%, as a vindication of its economic policies. For its part, the Dow Jones Industrials roared above the 10,500-level, buoyed by the “exploitation of labor,” that is still widening company profits.
So far, the recovery in the economy has been limited to Wall Street’s Oligarchs and S&P-500 multi-nationals, which are profiting from trillions in taxpayer bailouts, virtually unlimited and cheap credit, exports to growing emerging markets, and the use of mass unemployment to slash the wages of Americans working in the service sector, which accounts for 85% of the US-economy.
Meanwhile, top Wall Street firms have paid their employees a record $145-billion in compensation last year, while social programs for the elderly, such as Medicaid and Medicare are being slashed, and millions of other jobs wiped out. The banking oligarchs, whose greed and speculation caused the crisis, refuse to expand lending to the private sector, but instead, utilize zero-percent funds at their disposal, to gamble in the markets, with the backing of government-financed guarantees.
Stock market rallies often climb along a “wall of worry.” Yet despite persistent fears of a relapse into a “double-dip” recession, the most amazing aspect of the “Green Shoots” rally is the upward parabolic trajectory, was punctuated by only two brief corrections that barely caused a dent in the year-long bull market. The first correction in June 2009 was triggered by a sharp rise in 10-year Treasury yields to as high as the psychological 4-percent level. Yields have subsequently tumbled to 3.70%, far out of danger’s way, as far as market bulls are concerned.
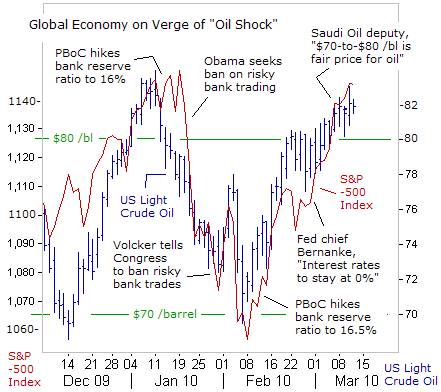
The second correction, in January 2010 was triggered by China’s surprising hike in bank reserve ratios, Obama’s backing for the “Volcker rule,” – banning risky trading by Wall Street Oligarchs, - and a surge in crude oil prices above $80 /barrel. However, PPT officials quickly put a safety net under the stock market, by promising to leave the Fed’s $2.2-trillion balance sheet untouched, and to maintain zero-percent borrowing costs for the biggest banks, for the rest of the year.
Thus, the Wall Street Oligarchs were able to return to the gambling table and re-engage in the most hazardous and riskiest forms of speculation. However, one of the consequences of the Fed’s ultra-easy money policies is a surge in crude oil prices above $80 /barrel, - further reducing the purchasing power of Americans’ shrinking wages. Now that oil prices have latched onto the stock market’s joy ride, any attempt by the PPT to catapult the S&P-500 Index rally above the January highs, runs the risk of jettisoning crude oil into the $85-to-$90 /barrel region.
On March 10th, Saudi Arabia’s deputy oil minister, Prince Abdulaziz bin Salman told reporters that a oil price of around $70-to-$80 /barrel was a satisfactory price for energy companies to invest in oil production capacity, and low enough for consumers that burn the fuel. Saudi Arabia, OPEC’s largest producer, has shouldered most of the 4.2-million bpd of supply cuts adopted by the cartel in late-2008. However, compliance to OPEC’s output quotas, outside of the Saudis, Kuwait and the UAE, has fallen to 53%, which means the cartel is cheating by 2-million bpd.
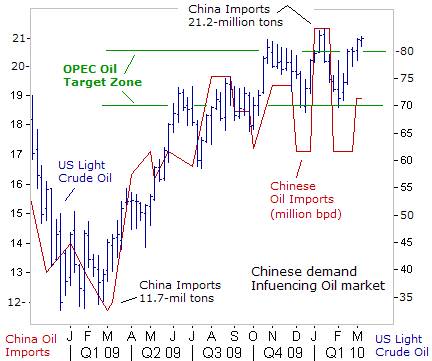
“Energy demand is likely to continue to grow, led by rising consumption in Asia and the Middle East,” bin Salman said, and the US Energy Information Agency predicts it could grow by 1.5-million bpd this year. China, the world’s second largest oil guzzler imported 4.8-million bpd in February, the second highest tally on record. If oil prices surge to $90 /barrel, with “carry trade” speculators bidding-up prices, Riyadh could quietly increase its oil output without much fanfare to cool the market, or China’s central bank might be forced into tightening its monetary policy again.
Surging oil prices could ignite an “Oil Shock” for the global economy, and the “Plunge Protection Team,” (PPT) would be forced into action, to intervene in the stock index futures markets, in order to limit the fallout. The PPT could also instruct the Fed to buy more T-bonds, to prevent yields from rising higher, due to inflationary pressures emerging in the commodities markets. At that point, “hot-money’ flows could once again, flow into the precious metals markets, sending gold to record heights.
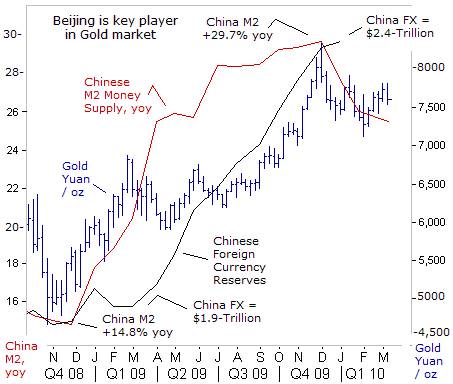
China’s exports are growing again, up +45% from a year ago, and “hot-money” inflows are rising, adding to the pool of cash sloshing about the Chinese economy. China’s stash of FX reserves has mushroomed to $2.4-trillion. At the same time, in order to keep the yuan tightly pegged to the US-dollar, the PBoC is buying vast quantities of US-dollars, Euros and yen for its FX-reserves, and simultaneously printing equal amounts of Chinese yuan, - thus, blowing bubbles in the Shanghai commodities markets, and buoying the gold market.
Beijing is nurturing fertile ground for the Shanghai gold market, which has already risen 54% against the yuan, since the central bank opened the money spigots in November 2008. Gold demand in China grew by 14% to around 450-tons in 2009, outstripping 315-tons of supply. Speculation is rife that Beijing is buying gold from state owned miners, to avoid sending the market price sharply higher.
Beijing has several “ideas and tool kits to manage inflationary expectations,” warned Liu Mingkang, chief of the China Banking Regulatory Commission, on March 9th. “Don’t get into too much of a panic or be afraid about inflation. China’s CPI and PPI may rise slightly, but there’s only a small chance that inflation will be more than moderate,” he said. China’s consumer inflation rate surged to +2.7% in February, and factory-gate inflation surges to +5.4% last month.
Thus, China’s inflation rate now exceeds the 2.25% interest rate on 12-month certificates of deposit, - encouraging savers to withdraw their cash from banks and buy gold bars. With food and energy accounting for half of China’s consumer price basket, soaring commodity prices are a ticking time bomb for social unrest. Yet Beijing is loath to further tighten its monetary policy, for fear of undermining the Shanghai stock market. “Oh what a tangled web we weave, when first we practice to deceive,” --Sir Walter Scott.
This article is just the Tip of the Iceberg of what’s available in the Global Money Trends newsletter. Subscribe to the Global Money Trends newsletter, for insightful analysis and predictions of (1) top stock markets around the world, (2) Commodities such as crude oil, copper, gold, silver, and grains, (3) Foreign currencies (4) Libor interest rates and global bond markets (5) Central banker "Jawboning" and Intervention techniques that move markets.
By Gary Dorsch,
Editor, Global Money Trends newsletter
http://www.sirchartsalot.com
GMT filters important news and information into (1) bullet-point, easy to understand analysis, (2) featuring "Inter-Market Technical Analysis" that visually displays the dynamic inter-relationships between foreign currencies, commodities, interest rates and the stock markets from a dozen key countries around the world. Also included are (3) charts of key economic statistics of foreign countries that move markets.
Subscribers can also listen to bi-weekly Audio Broadcasts, with the latest news on global markets, and view our updated model portfolio 2008. To order a subscription to Global Money Trends, click on the hyperlink below, http://www.sirchartsalot.com/newsletters.php or call toll free to order, Sunday thru Thursday, 8 am to 9 pm EST, and on Friday 8 am to 5 pm, at 866-553-1007. Outside the call 561-367-1007.
Mr Dorsch worked on the trading floor of the Chicago Mercantile Exchange for nine years as the chief Financial Futures Analyst for three clearing firms, Oppenheimer Rouse Futures Inc, GH Miller and Company, and a commodity fund at the LNS Financial Group.
As a transactional broker for Charles Schwab's Global Investment Services department, Mr Dorsch handled thousands of customer trades in 45 stock exchanges around the world, including Australia, Canada, Japan, Hong Kong, the Euro zone, London, Toronto, South Africa, Mexico, and New Zealand, and Canadian oil trusts, ADR's and Exchange Traded Funds.
He wrote a weekly newsletter from 2000 thru September 2005 called, "Foreign Currency Trends" for Charles Schwab's Global Investment department, featuring inter-market technical analysis, to understand the dynamic inter-relationships between the foreign exchange, global bond and stock markets, and key industrial commodities.
Copyright © 2005-2010 SirChartsAlot, Inc. All rights reserved.
Disclaimer: SirChartsAlot.com's analysis and insights are based upon data gathered by it from various sources believed to be reliable, complete and accurate. However, no guarantee is made by SirChartsAlot.com as to the reliability, completeness and accuracy of the data so analyzed. SirChartsAlot.com is in the business of gathering information, analyzing it and disseminating the analysis for informational and educational purposes only. SirChartsAlot.com attempts to analyze trends, not make recommendations. All statements and expressions are the opinion of SirChartsAlot.com and are not meant to be investment advice or solicitation or recommendation to establish market positions. Our opinions are subject to change without notice. SirChartsAlot.com strongly advises readers to conduct thorough research relevant to decisions and verify facts from various independent sources.
Gary Dorsch Archive |
© 2005-2022 http://www.MarketOracle.co.uk - The Market Oracle is a FREE Daily Financial Markets Analysis & Forecasting online publication.