Stock Market S&P 500 Parts and Pieces Performance
Stock-Markets / Stock Markets 2010 Mar 17, 2010 - 03:36 PM GMTBy: Richard_Shaw
 Good news or bad news on the fundamental and macroeconomic front, US stocks are on a clear up trend. The small-cap and mid-cap stocks are farther above their January highs than the large-cap stocks, but the large-cap stocks are doing well too.
Pretty much no matter how you slice it (market-weighted, equal weighted, sector equal weighted, earnings weighted, revenue weighted, or dividend weighted), the S&P 500 (and large-cap) US stock market is in a clear up trend.
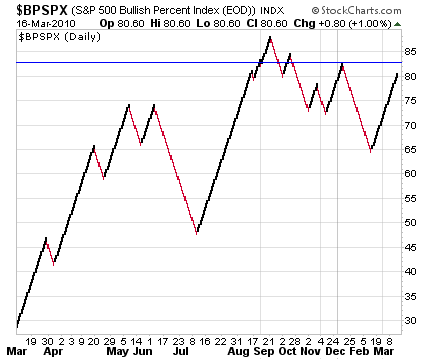
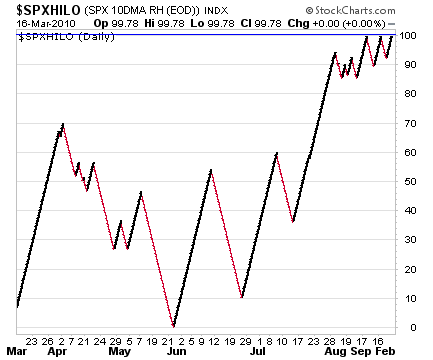
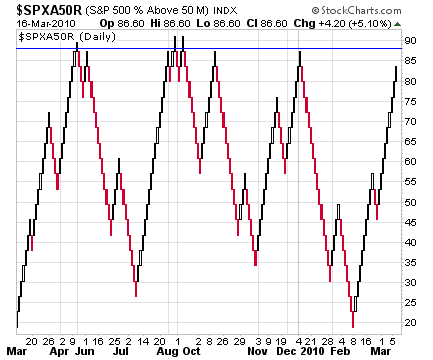
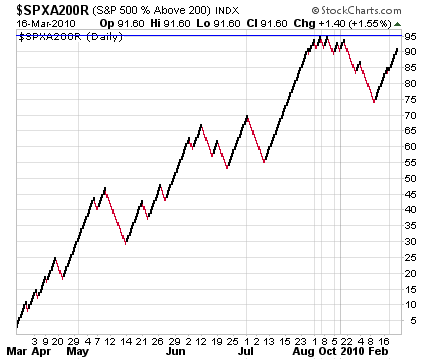
Some indicators of upward strength (such as Point & Figure Bullish Percent, New Hi/Lo Ratio, Percent Above 50-Day Average, and Percent Above 200-Day Average) are very high, which doesn’t leave much room for improvement, and therefore makes the large-caps fairly vulnerable to at least some slowing down, if not some correction. However, up its up until its down. Keep stops on all positions.
The individual sectors vary in price recovery from the post-January low, perhaps creating some catch-up opportunity, although the laggards may be behind for good reason.
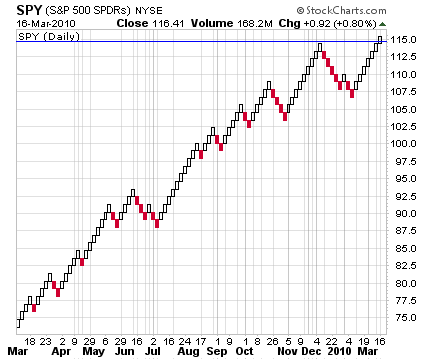
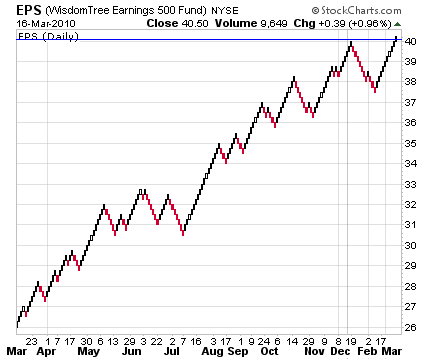
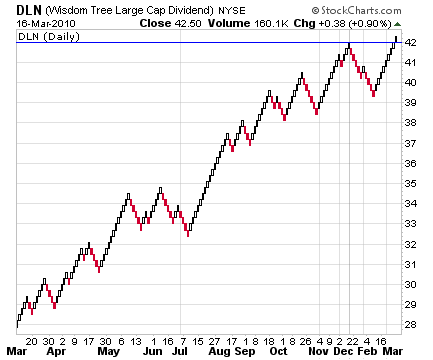
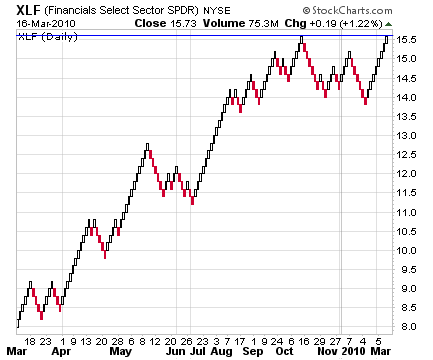
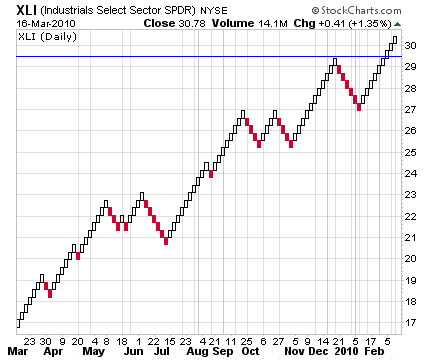
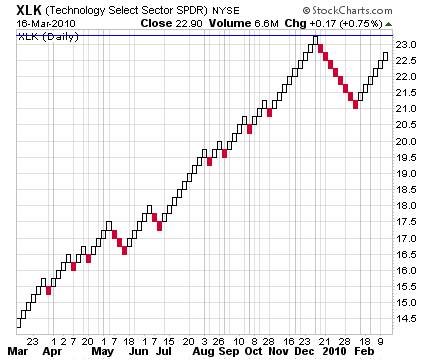
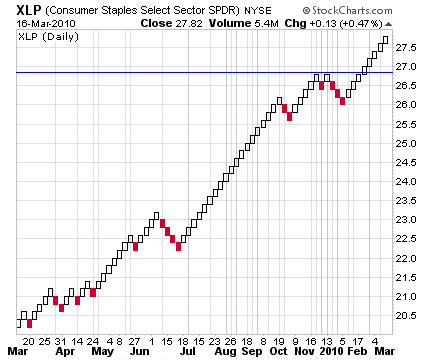
All of the charts below are Renko (Brick) charts. That type of chart, like Point & Figure charts, is independent of time. It plots “bricks” (or “boxes”) of equal size whenever the price moves at least as much as a minimum amount, which in this case is the 10-day average daily range of prices for that security (that means the point change required for a new box varies as the range of the daily price varies). Brick charts are reasonably effective at visualizing trends as well as support and resistance.
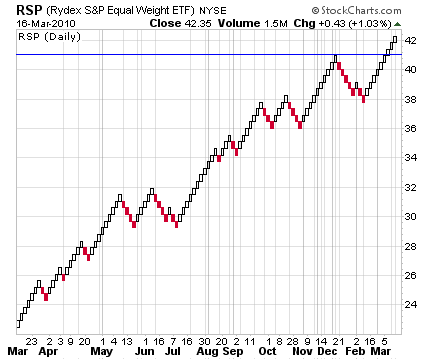
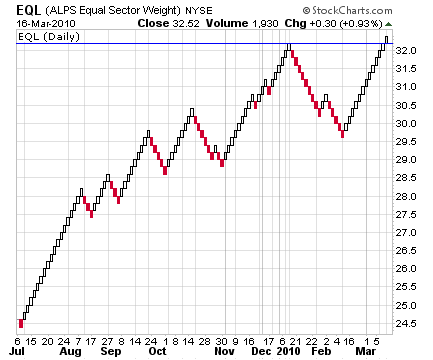
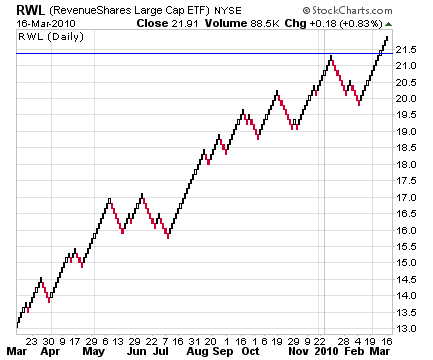
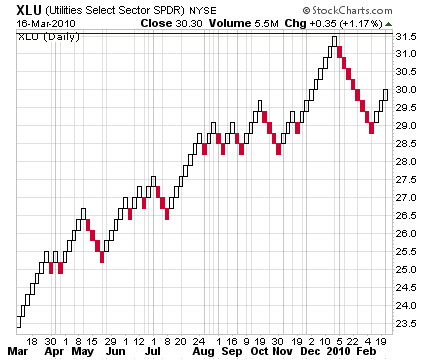
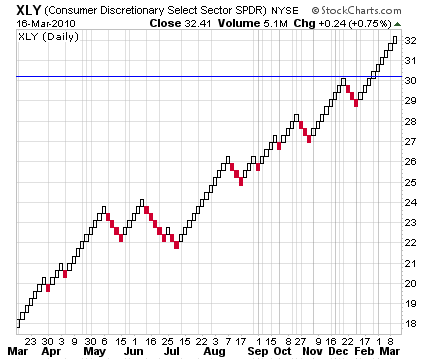
In each chart, a blue horizontal line marks the January high.
S&P 500 (proxy SPY) Above January High:
The current price brick is above the January high, having recovered fully from the mid-January decline. The price pattern shows higher lows and higher highs, one of the most basic definitions of an up trend.
Variations on the S&P 500 Up Too:
The S&P 500 Equal Weight index (proxy RSP) is ahead of the standard S&P 500 index, because the smaller constituents have much more representation in the overall price level — consistent with the out-performance by mid-cap and small-cap indexes.
The S&P 500 Equal Sector Weight Index Above January:
The S&P Equal Sector Weight index (proxy EQL) is above its January high, although the 9 separate sectors shown later are not all above the January high.
Fundamentally Weighted Close Relatives to the S&P 500:
While not an exact version of the S&P 500, the RevenueShares Large Cap ETF (symbol RWL) is quite similar to the S&P 500 constituent list. It too is well above its January high.
The WisdomTree 500 Earnings weighted ETF (symbol EPS) is just above its January high.
The WisdomTree Large-Cap Dividend weighted ETF (symbol DLN) is above its January high.
S&P 500 Sectors Vary In Post-January Recovery:
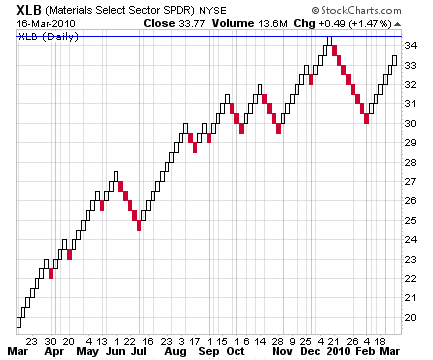
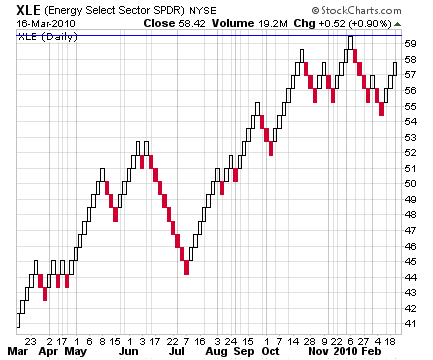
If we rank the sectors by the number of boxes above or below the January high, they look like this:
- XLY +6
- XLP +5
- XLI +3
- XLF +0
- XLB, XLE, XLK, and XLV -2
- XLU -5
Some S&P 500 Internal Indicators:
These indicators are strong. That’s the good news. The cautionary news is that they can’t get much higher, although they could remain elevated for extended periods.
Holdings Disclosure:
As of March 16, 2010, we hold SPY in some, but not all managed accounts, We do not have current positions in any other securities discussed in this document in any managed account.
By Richard Shaw
http://www.qvmgroup.com
Richard Shaw leads the QVM team as President of QVM Group. Richard has extensive investment industry experience including serving on the board of directors of two large investment management companies, including Aberdeen Asset Management (listed London Stock Exchange) and as a charter investor and director of Lending Tree ( download short professional profile ). He provides portfolio design and management services to individual and corporate clients. He also edits the QVM investment blog. His writings are generally republished by SeekingAlpha and Reuters and are linked to sites such as Kiplinger and Yahoo Finance and other sites. He is a 1970 graduate of Dartmouth College.
Copyright 2006-2010 by QVM Group LLC All rights reserved.
Disclaimer: The above is a matter of opinion and is not intended as investment advice. Information and analysis above are derived from sources and utilizing methods believed reliable, but we cannot accept responsibility for any trading losses you may incur as a result of this analysis. Do your own due diligence.
Richard Shaw Archive |
© 2005-2022 http://www.MarketOracle.co.uk - The Market Oracle is a FREE Daily Financial Markets Analysis & Forecasting online publication.


