


Silver SLV ETF
Commodities / Gold and Silver 2010 Mar 18, 2010 - 11:07 AM GMTBy: Guy_Lerner

 In our first crack at this, I felt that SLV was vulnerable. In the article, "As A Corollary To A Higher Dollar....GLD, GDX, SLV", I stated: "it is my expectation that precious metals will be under pressure." In this market, where almost all assets move in one direction, SLV got slammed over the next 2 weeks. Good call!
Then a month later, I wrote: "Did You Sell GLD, GDX, SLV?" Not only was I all poofed up because of my prior "call", but I was making another one as GLD, SLV, and GDX appeared vulnerable. Wrong! Two days later, I wrote "Deflated!" acknowledging my error. To my credit on this one, at least I reversed course quickly.
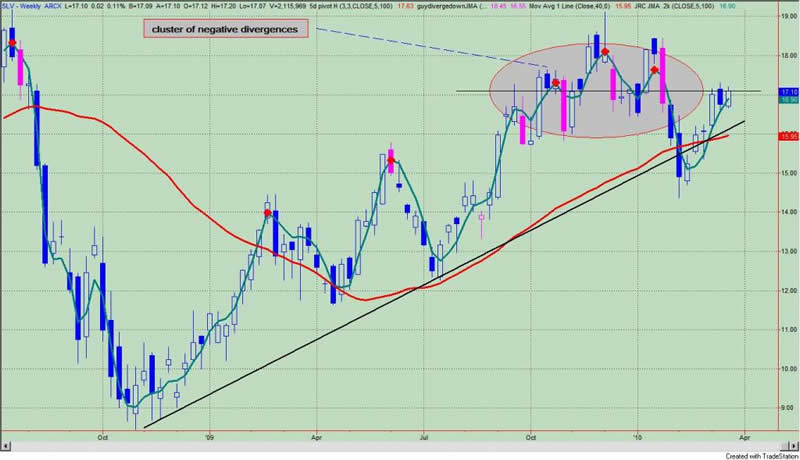
In any case, let's try this a third time. I will only focus on SLV. Figure 1 is a weekly chart of the SLV. The cluster of negative divergences is identified, and this is formidable resistance. A head and shoulders top is also seen, and the recent price move can be interpreted as the "throwback" into resistance once price breaks below the neck line.
Figure 1. SLV/ weekly
Another reason to be bearish on SLV has to do with sentiment; specifically, the Market Vane Bullish Consensus has become extremely bullish on silver. It isn't an absolute extreme, but an extreme relative to past swing highs. See figure 2, a daily look at SLV with the Market Vane Bullish Consensus data in the lower panel.
Figure 2. SLV/ daily
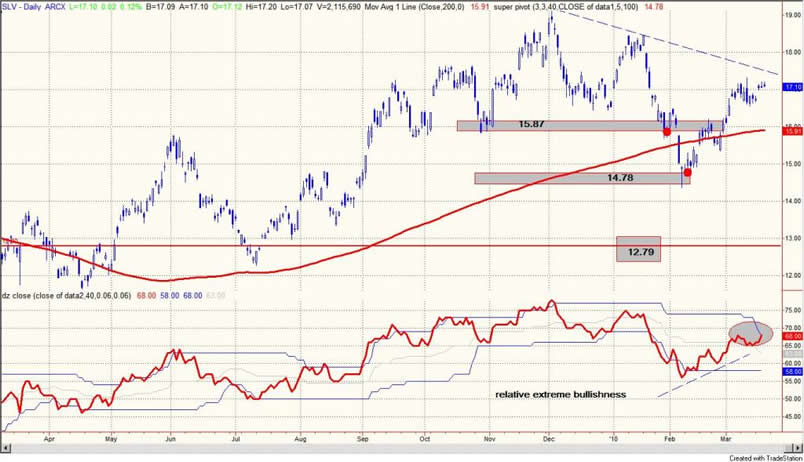
The descending tops are easily seen. In the lower panel, sentiment is reaching an extreme bullish reading as the indicator is moving outside the upper trading band. While we know that extremes in bullish sentiment can persist for longer than most expect, I don't believe that will be the case here as it will be a significant effort for both price and sentiment to break to new swing highs.
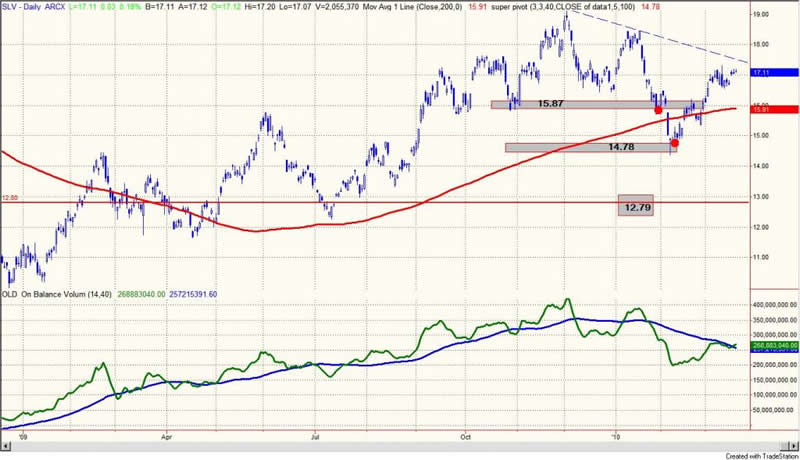
Lastly, I will show a daily chart of the SLV with the on balance volume indicator with a 40 week moving average in the lower panel. See figure 3. The indicator has clearly rolled over, and the recent spike higher in prices has not been accompanied by a significant move in the OBV indicator over the 40 week moving average.
Figure 3. SLV/ daily
By Guy Lerner
http://thetechnicaltakedotcom.blogspot.com/
Guy M. Lerner, MD is the founder of ARL Advisers, LLC and managing partner of ARL Investment Partners, L.P. Dr. Lerner utilizes a research driven approach to determine those factors which lead to sustainable moves in the markets. He has developed many proprietary tools and trading models in his quest to outperform. Over the past four years, Lerner has shared his innovative approach with the readers of RealMoney.com and TheStreet.com as a featured columnist. He has been a regular guest on the Money Man Radio Show, DEX-TV, routinely published in the some of the most widely-read financial publications and has been a marquee speaker at financial seminars around the world.
© 2010 Copyright Guy Lerner - All Rights Reserved
Disclaimer: The above is a matter of opinion provided for general information purposes only and is not intended as investment advice. Information and analysis above are derived from sources and utilising methods believed to be reliable, but we cannot accept responsibility for any losses you may incur as a result of this analysis. Individuals should consult with their personal financial advisors.
Guy Lerner Archive |
© 2005-2022 http://www.MarketOracle.co.uk - The Market Oracle is a FREE Daily Financial Markets Analysis & Forecasting online publication.