Economic and Stock Market Recovery, Maybe The Emperor Has No Clothes
Stock-Markets / Stock Markets 2010 Mar 18, 2010 - 11:38 AM GMTBy: Charles_Maley
 It seems the general consensus is we are in a full blown recovery. There is little doubt that the worse of this crisis is over. I sure hope that is true, but when I see complacency in the financial markets such as I see today, so soon behind a meltdown, I have concern.
The politicians on the hill and the talking heads on the T.V. can say what they want, but there are few recoveries without the participation of the consumer. Economic stability depends on consumer confidence, which results in consumer spending, not through a barrage of Government spending.
Patrice Hill, from The Washington Times, made an astute observation that I think few realize. Just how damaged was household income without Government help? How bad of shape is the regular Joe actually in?
According to her research, “Without record levels of welfare, unemployment and other government benefits as well as tax cuts last year, the income of U.S. households would have plunged by an astonishing $723 billion — more than four times the record $167 billion drop reported last month by the Commerce Department.
Moreover, for the first time since the Great Depression, Americans took more aid from the government than they paid in taxes. The figures show the devastating results of the massive job losses last year and indicate that the economic recovery that began last summer is tenuous and has a long way to go before many Americans resume life as normal.”
It seems to me that the Government was critical in keeping the consumer from completely collapsing, and there has been little revival in the consumer sector with respect to jobs and private income.
What’s funny is the investment community sees the opposite.
Mark Hulbert at market watch was quoted as saying “Based on the several hundred investment advisers I track, I’d have to say that bullish sentiment is approaching dangerously high levels. Consider the Hulbert Stock Newsletter Sentiment Index (HSNSI), which represents the average recommended stock market exposure among a subset of short term stock market timers tracked by the Hulbert Financial Digest.
It currently stands at 62.8%, up from 13.8% just one month ago. That’s an awfully big jump for so short a period of time, especially considering that the Dow Jones Industrial Average rose a modest 4.4% over this period. Also worrying is that, with but one exception, the HSNSI is now at its highest level since early 2007, more than three years ago.”
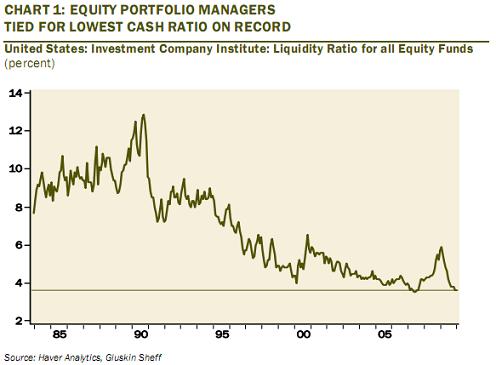
In addition, Haver Analytics posted this chart on Seeking Alpha, which backs up the Hulbert report showing the near-record low cash levels. I guess equity managers in general are more fearful of “missing out” than they are of a reasonable correction.
Cash holdings are now 3.6% of assets down from a recent peak of over 6%, which is the largest decline in 19 years. Equity cash ratios are back to where they were in September 2007, just as the stock market was hitting its peak.

How about the valuations at these levels, are stocks cheap?
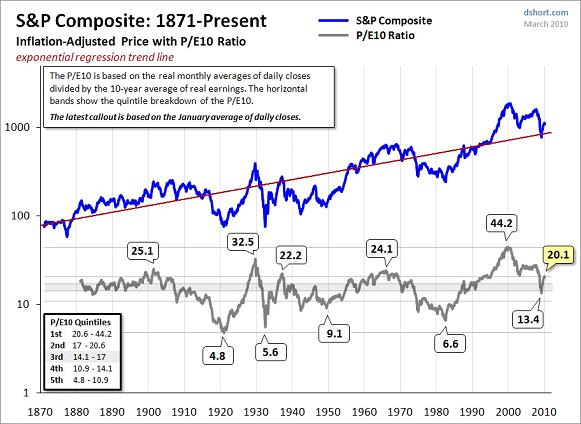
The PE ratio for the S&P is currently 21.18, compared to the mean of 16.35.
The S&P dividend yield is currently 1.95% just off the August 2000 lows of 1.11% and well below the mean of 4.37%.
The current price to book value is 2.45.
The current trailing twelve month earnings are 58.60 (source dshort.com)
Projected S&P Price at current levels (58.60x 21.18) = 1241
Projected S&P Price at mean multiple (58.60x 16.35) = 958

So, where does that put us?
According to dshort.com, “For a more precise view of how today’s P/E10 relates to the past, our chart includes horizontal bands to divide the monthly valuations into quintiles — five groups, each with 20% of the total. Ratios in the top 20% suggest a highly overvalued market, the bottom 20% a highly undervalued market. What can we learn from this analysis? Over the past several months, the decline from the all-time P/E10 high dramatically accelerated toward value territory, with the ratio dropping from the 1st to the upper 4th quintile in March. The price rebound since March has now put the ratio at the top of the 2nd quintile — quite expensive!
A more cautionary observation is that every time the P/E10 has fallen from the first to the fourth quintile, it has ultimately declined to the fifth quintile and bottomed in single digits. Based on the latest 10-year earnings average, to reach a P/E10 in the high single digits would require an S&P 500 price decline below 600. Of course, a happier alternative would be for corporate earnings to make a strong and prolonged surge. When might we see the P/E10 bottom? These secular declines have ranged in length from over 19 years to as few as three. The current decline is now nearing its tenth year.”
Enjoy this article? Like to receive more like it each day? Simply click here and enter your email address in the box below to join them.
Email addresses are only used for mailing articles, and you may unsubscribe any time by clicking the link provided in the footer of each email.
Charles Maley
www.viewpointsofacommoditytrader.com
Charles has been in the financial arena since 1980. Charles is a Partner of Angus Jackson Partners, Inc. where he is currently building a track record trading the concepts that has taken thirty years to learn. He uses multiple trading systems to trade over 65 markets with multiple risk management strategies. More importantly he manages the programs in the “Real World”, adjusting for the surprises of inevitable change and random events. Charles keeps a Blog on the concepts, observations, and intuitions that can help all traders become better traders.
© 2010 Copyright Charles Maley - All Rights Reserved Disclaimer: The above is a matter of opinion provided for general information purposes only and is not intended as investment advice. Information and analysis above are derived from sources and utilising methods believed to be reliable, but we cannot accept responsibility for any losses you may incur as a result of this analysis. Individuals should consult with their personal financial advisors.
© 2005-2022 http://www.MarketOracle.co.uk - The Market Oracle is a FREE Daily Financial Markets Analysis & Forecasting online publication.


