


FTSE 100 Index UK Stock Market Summer Correction Over?
Stock-Markets / UK Stock Market Aug 12, 2007 - 10:10 PM GMTBy: Nadeem_Walayat

The US Subprime fallout in the form of the ongoing Credit Crunch has taken the FTSE 100 Index sharply lower in a short space of time. The FTSE has fallen into the target zone of 6050 to 6000 and therefore implies that the correction is over and a strong rally is now due. The ongoing impact of hedge fund failures is likely to impact the stock markets across the world for some time to come therefore will be a factor in generation of short-term volatility in the UK Stock market for many more months.
However, market participants are now aware of factors such as future hedge fund failures and the large number of Arm's resetting in the new year, which is termed by many now as 'Arm'ageddon. This implies that future market reactions are likely to be much more muted as the market has been in the process of adjusting to the higher risk environment. Additionally in the UK, the recent foot and mouth outbreak appears to be under control and as long as it remains so, its implications can be discounted from the equation.
Technical Analysis of the FTSE 100 Index
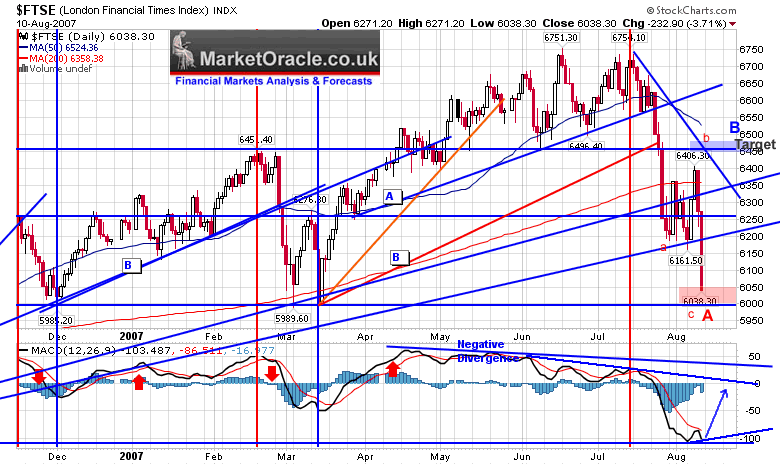
1. Trend Analysis - The FTSE has fallen sharply to the target zone for the summer correction of between 6000 to 6050 as of Friday's close of 6038. Therefore the FTSE is now expected to rally from here. Clear strong support exists at 6000, therefore I cannot imagine any sort of a break lower without a significant reaction higher first. To the upside, the first resistance level is at the last low of 6161, this is expected to break easily and propell the FTSE towards the upper end of the wide congestion zone of 6400 to 6200. The FTSE may stall at 6400 on the initial attempt at a break higher, and react back towards the lower end of the zone at 6200. However a break of 6400 is being anticipated towards the target of 6480. Thereafter the FTSE will meet heavy resistance in the region 6480 to 6500. Given the recent sharp reaction lower to 6038, which was steeper than expected, the FTSE on failure at the upside target area denoted by B on the chart could start a third leg lower towards the 6000 from there.
2. Time Analysis - The FTSE's decline price / time wise has been pretty severe, with the price target reached ahead of the anticipated low of early September by some 3 weeks. This suggests that the stock market is weak, and moving more per time unit downwards than can be expected for the anticipated summer correction and thus implies greater weakness further out i.e. during late Sept and going into October this year.
3. Elliott Wave Analysis - Taking account of trend analysis and time analysis - The Elliott wave pattern suggests an ABC downward pattern of a magnitude greater than the original ABC correction envisaged to between 6000 and 6050. Thus the current decline is taken as an A wave decline, and thus now we can expect a good B wave rally, with a further C wave decline. However it can still make a lower C wave whilst not breaking the 6000 support level, which would be a sign of strength for the bull market. A lot now depends on - a) whether elliott wave analysis proves accurate, or b) Whether 6000 holds on the C wave decline. But those are for the future. Currently elliott wave confirms a significant rally from Fridays close of 6038.
4. MACD Indicator - Has fallen to extreme oversold levels, with the latest decline on Friday failing to push the indicator to a new low. This implies a higher second bottomed is in the making and implies a sharp rally is likely to bring the FTSE out of its oversold state. Therefore the MACD indicator is strongly bullish for the FTSE over the coming week and at least and confirms both Trend and Elliott wave analysis.
Summary - The FTSE 100 Index is expected to rally strongly from Friday's close of 6038 and is anticipated to retrace more than 60% of the decline from 6754 to 6038 to an target of 6480-6500. Subsequent to this target there is reason to suspect that the FTSE may revisit the 6000 to 6050 zone again probably during October 2007 (elliott wave), however, first things first, expect a strong rally in the FTSE 100 Index starting Monday.
Related Articles
- FTSE 100 Index Crashes to 6250 - What's Next ? - 26th July 07
- FTSE 100 Index Summer Outlook - 28th April 07
By Nadeem Walayat
(c) Marketoracle.co.uk 2005-07. All rights reserved.
The Market Oracle is a FREE Daily Financial Markets Forecasting & Analysis online publication. We present in-depth analysis from over 100 experienced analysts on a range of views of the probable direction of the financial markets. Thus enabling our readers to arrive at an informed opinion on future market direction. http://www.marketoracle.co.uk
Disclaimer: The above is a matter of opinion provided for general information purposes only and is not intended as investment advice. Information and analysis above are derived from sources and utilising methods believed to be reliable, but we cannot accept responsibility for any trading losses you may incur as a result of this analysis. Individuals should consult with their personal financial advisors before engaging in any trading activities.
Nadeem Walayat Archive |
© 2005-2022 http://www.MarketOracle.co.uk - The Market Oracle is a FREE Daily Financial Markets Analysis & Forecasting online publication.