


Stock Market Indices Hit 18 Month Highs on Fed Policy Statement
Stock-Markets / Financial Markets 2010 Mar 21, 2010 - 01:36 PM GMT

 The major stock market indices added to their gains this week - obtaining comfort from the Fed’s policy statement that the “juice” was not about to be removed anytime soon - and hit 18-month highs before closing down on Friday as “quadruple witching day” in the US weighed on sentiment. A day earlier on Thursday, the S&P 500 tracking ETF (SPY) broke a 14-day winning streak - its longest since the launch of the ETF in 1993.
The Federal Open Market Committee (FOMC) on Tuesday once again announced that the fed funds rate target was likely to remain “exceptionally low” for “an extended period”. The communiqué was slightly more upbeat on the outlook for the economy, saying the labor market was “stabilizing” (last statement: “the deterioration in the labor market is abating”), although a number of constraints on growth remained.
The FOMC’s statement “met market expectations on the three key aspects of leaving interest rates unchanged, maintaining dovish language about future policy moves and allowing the special programs to lapse,” Mohamed El-Erian, chief executive and co-chief investment officer of Pimco told Reuters (via MoneyNews). He added that the end of the Fed’s program of purchasing $1.25 trillion of mortgage-backed securities at the end of March signaled a form of credit tightening. Traders are also expecting an increase in the Fed’s discount rate from 50 basis points above the fed funds rate to the pre-crisis margin of 100 basis points.
Meanwhile, US Senate Banking Committee chairman Christopher Dodd introduced a revised version of a financial regulatory reform bill on Monday. “The Act’s reduced risk retention requirements and its recognition of its potentially negative impact on access to credit by consumers and businesses are encouraging, but the amount of discretion left with the regulators would be troubling to securitizers and originators. However, the delay in the effectiveness of final implementing regulations until, at the earliest, 2012, would give the industry an opportunity to adjust to the new requirements or to petition Congress for relief,” reported lawyers Edward De Sear and Charles Sweet (Bingham).
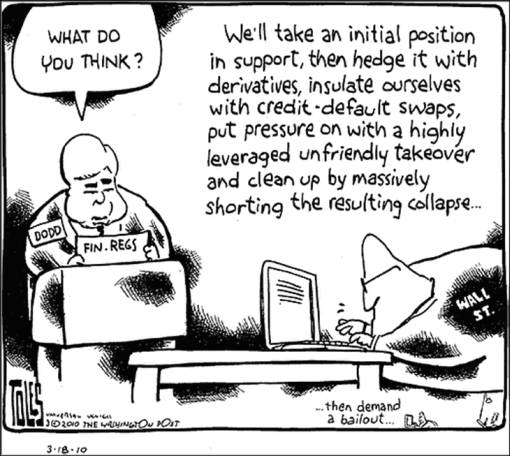
Source: Tom Toles, GoComics.com, March 18, 2010.
The past week’s performance of the major asset classes is summarized in the chart below - a somewhat mixed picture with equities, high-grade corporate bonds, gold, government bonds and the US dollar all higher as pundits waxed and waned between risky assets and safe havens. However, oil and commodities were pushed lower on the back of the stronger greenback. It should be interesting to see how the bond vigilantes handle this week’s auction of $118 billion worth of Treasuries, in the joint-largest auction on record. (For some perspective regarding the short-term outlook for the various asset classes, click the following links for Adam Hewison’s (INO.com) latest technical analyses: S&P 500, US dollar, gold bullion and crude oil.)
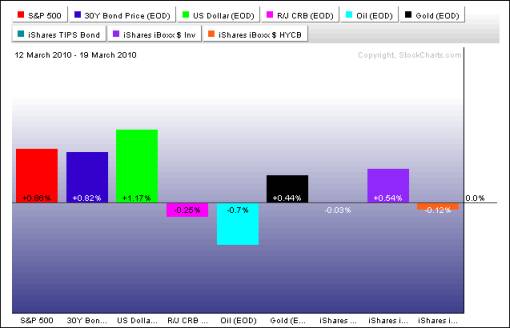
Source: StockCharts.com
A summary of the movements of major global stock markets for the past week and various other measurement periods is given in the table below.
The cyclical bull market that commenced on March 9, 2009 marched higher during the past week, albeit with some hesitancy and a weak finish by the close. The MSCI World Index and the MSCI Emerging Markets Index gained 0.8% and 0.9% respectively.
As one would expect during a bull market, small caps have been a leading performer since the low of March 9 last year, with the Russell 2000 Index gaining 96.3% compared to a rise of 71.4% in the S&P 500 Index. Considering the last few days, however, small caps seem to have been tiring. As a result, the Russell 2000 Index has been the only major US stock market index to register a loss for the past week. As mentioned in a post yesterday, I will be keeping a close watch on this possible canary in the coalmine in order to gauge the most likely short-term direction for small caps and stocks in general.
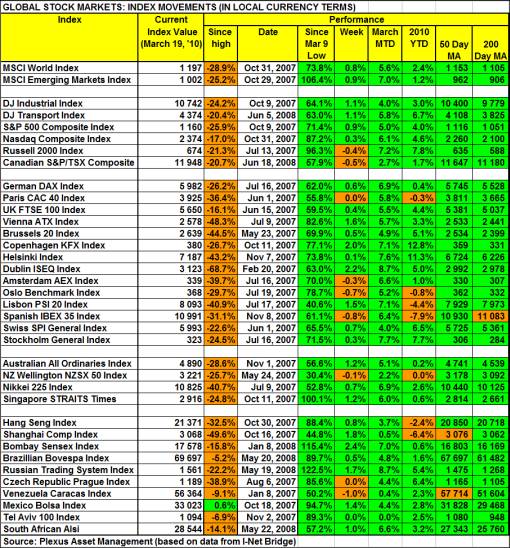
Top performers among the entire spectrum of stock markets this week were Ukraine (+8.1%), Qatar (+7.3%), Thailand (+6.7%), Uganda (+4.8%) and Greece (+3.7%). At the bottom end of the performance rankings, countries included Cyprus (-6.7%), Costa Rica (-3.5%), Malawi (-3.4%), Nepal (-2.8%) and Macedonia (-2.7%).
Of the 96 stock markets I keep on my radar screen, 64 (last week 74%) recorded gains, 33% (21%) showed losses and 3% (5%) remained unchanged. The performance map below tells the past week’s mostly bullish story.
Emerginvest world markets heat map
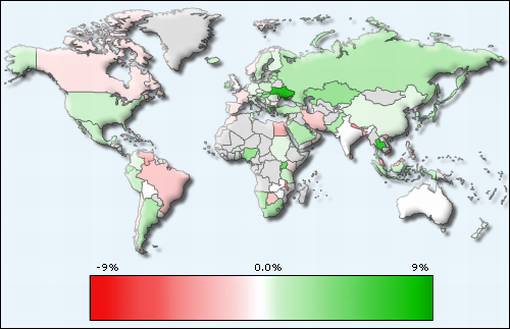
Source: Emerginvest (Click here to access a complete list of global stock market movements.)
Nine of the ten economic sectors of the S&P 500 closed higher for the week, with Telecoms (+2.4%) and Industrials (+2.2%) leading the pack and Energy (-1.1%), Materials (+0.2%) and Technology (+0.2%) forming the rear guard.
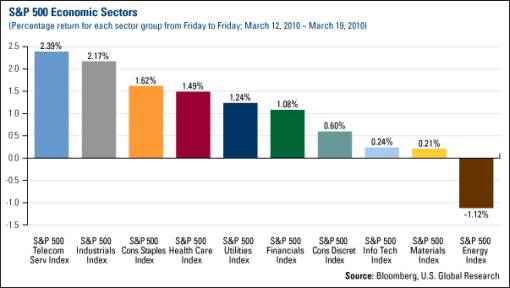
Source: US Global Investors - Weekly Investor Alert, March 19, 2010.
John Nyaradi (Wall Street Sector Selector) reports that as far as ETFs are concerned, the winners for the week included iShares MSCI Thailand (THD) (+6.2%), iShares Dow Jones US Health Providers (IHF) (+4.2%) and iShares MSCI South Africa (EZA) (+3.7%).
At the bottom end of the performance rankings, ETFs included First Trust ISE-Revere Natural Gas (FCG) (-5.7%), United States Natural Gas (UNG) (-5.5%) and Claymore/MAC Global Solar Energy (TAN) (-5.4%).
Criticizing Paul Krugman’s comments that the US should consider a 25% surcharge on Chinese goods, the quote du jour this week comes from Stephen Roach, chairman of Morgan Stanley Asia. He said in a Bloomberg interview: “We should take out the baseball bat on Krugman. … They don’t want to look in the mirror. America doesn’t have a China problem. It really has a savings problem. America has the biggest shortfall of national savings of any leading country in modern history. And when you don’t have savings you have to run current account deficits to import surplus savings from abroad and run massive trade deficits to attract the capital. Last year America ran trade deficits with over 90 - that’s right nine zero - countries. … Isn’t it the height of hypocrisy that America can articulate a particular position in its currency but the Chinese are not allowed to do that.” (Hat tip for transcript: Credit Writedowns.)
Elsewhere, the Financial Times reported that President Barack Obama appeared to be nearing victory in his epic struggle to push healthcare reform through a reluctant US Congress in a vote today (Sunday).
Next, a quick textual analysis of my week’s reading. This is a way of visualizing word frequencies at a glance. The usual suspects such as “bank”, “debt”, “government”, “market” and “rate” featured prominently, with “China” also again in the limelight as China’s Premier Wen Jiabao rebuffed calls from the US for the renminbi to appreciate.

The major moving-average levels for the benchmark US indices, the BRIC countries and South Africa (where I am based in Cape Town when not traveling) are given in the table below. With the exception of the Shanghai Composite Index that is flirting with its 50- and 200-day lines, the indices in the table are all trading above their key moving averages.
The table also provides the February lows for the various indices as these must hold in order for the cyclical bull market to remain intact.

I am repeating the following paragraph from last week’s review as it is worth revisiting: “Using Fibonacci retracement lines, the S&P 500 is now testing the 62% retracement line drawn from the May 2008 peak to the March 2009 bottom (see purple lines). According to John Murphy (StockCharts.com), a break of this key upside target raises the possibility that the Index could retrace 62% of the entire bear market that started in the fourth quarter of 2007, in which case the potential upside target is 1,232 (see green lines).”
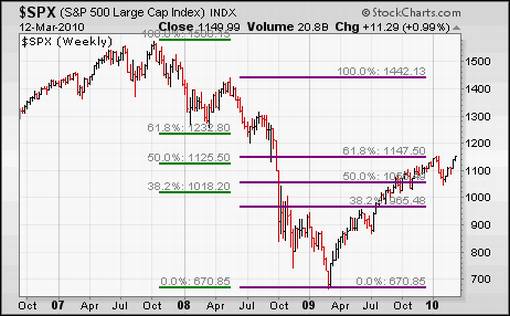
Source: StockCharts.com
Also commenting on the technical picture of the S&P 500, Kevin Lane (Fusion IQ) said: “We remain cautiously optimistic with the trend up, internals strong, the Russell 2000, the NASDAQ and now the S&P 500 at new recovery highs. Skeptics remain the loudest people in the room and while their concerns may be valid we have learned that the market rewards the minority and confounds the majority. The S&P 500 cleared its previous resistance peak near 1,150 and now looks to challenge the 1,200 level. Although there may be some back and filling along the way, we have long argued that there would be one last move up driven by investors who skeptically avoided the market.”
A week ago, Jeffrey Saut (Raymond James) said: “Nassim Taleb (trader extraordinaire) has 10 rules. Rule number 8 reads: ‘No matter how confident, always protect the downside.’ We agree and therefore always try to ‘look’ down before looking up in an attempt to manage the risk. As for the ‘here and now’, the broadest index of them all, the Wilshire 5000, has strung together 11 consecutive higher sessions, a feat not seen since the mid-1990s. Accordingly, it is pretty overbought on a short-term basis. That upside skein can be seen in the candlestick charts, which have not experienced a downside ‘red candlestick’ session since the upside reversal of February 25, 2010. [PduP: Last week saw three declines.]
“We are therefore turning cautious, but not bearish, on a trading basis. That strategy suggests a short-term correction is potentially due, but NOT an intermediate-term bearish decline. Indeed, since the end of the envisioned January/February ’selling stampede’, we have been constructive on stocks. However, we currently think pairing some trading positions, and/or raising stop-loss points, is warranted.
“Meanwhile, the Reuters/Jefferies CRB Index (commodities) broke below its rising trendline, the 10-Year Treasury Yield Index (TNX/3.71) broke above its 50-day moving average (read: higher rates), the Volatility Index (VIX/17.58) continued to trade below 18 (read: too much complacency), mutual fund cash positions are at historic lows of 3.6%, and the NYSE overbought/oversold indicator tagged a rare overbought reading above 90 last week. Ergo, color us cautious in the very short-term.”
“Where breadth goes, the market usually follows,” goes an old market saw. Analyzing market internals, the number of S&P 500 stocks trading above their respective 50-day moving averages has increased to 87% from 21% in early February (see chart below). “At these levels, there really hasn’t been much more room to run on the upside before a short-term pullback (or at least sideways trading) has been seen,” said Bespoke. For a primary uptrend to be in place, the bulk of the index constituents also need to trade above their 200-day averages. The number at the moment is 90% - somewhat down from its September peak of 95%, but nevertheless firmly in bullish terrain.
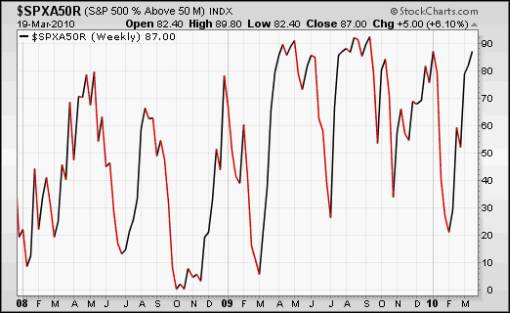
Source: StockCharts.com
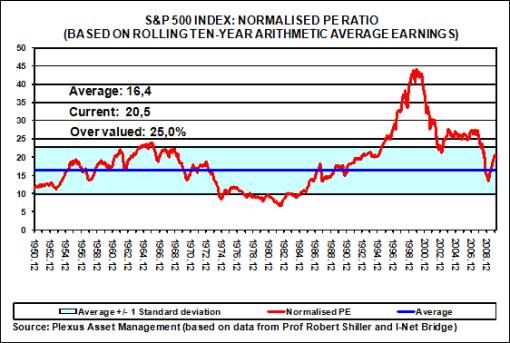
In addition to being overbought, the S&P 500 is also now expensively valued on a long-term cyclically adjusted PE (CAPE) basis, according to Robert Shiller, economics professor at Yale and author of, among others, Animal Spirits, Subprime Solution and Irrational Exuberance.
In order not to work with notoriously unreliable forward-looking earnings estimates, I have always preferred using Shiller’s CAPE methodology, or normalised earnings, as they average ten years of earnings. This measure provides a good picture of the market’s value regardless of where we are in the business cycle. I have therefore been updating a CAPE chart for a number of years. On this basis, the multiple has increased to 20.5 since the March low of 13.3, representing an overvaluation of 25.0% when compared to a long-term average of 16.4.
For more discussion on the economy and financial markets, see my recent posts “Picture du Jour: Keep an eye on small caps“, “Government bonds - what’s up?“, “Is real estate rolling over?“, “Technical Talk: One last move up“, “Chinese stocks - finely balanced“, “Stock market valuation is stretched on long-term basis“, “Author Michael Lewis on Wall Street’s delusion” and “Barron’s Confidence Index - more work to do“. (And do make a point of listening to Donald Coxe’s webcast of March 19, which can be accessed from the sidebar of the Investment Postcards site.)
Twitter and Facebook
I regularly post short comments (maximum 140 characters) on topical economic and market issues, web links and graphs on Twitter. For those readers not doing so already, you can follow my “tweets” by clicking here. You may also consider joining me as a friend on Facebook.
Economy
The Recession Status Map below, courtesy of Dismal Scientist Economy.com, aggregates growth statistics from around the world and allows one to see at a glance which economies are in recession, at risk, recovering or expanding. Click here to link to the interactive version.
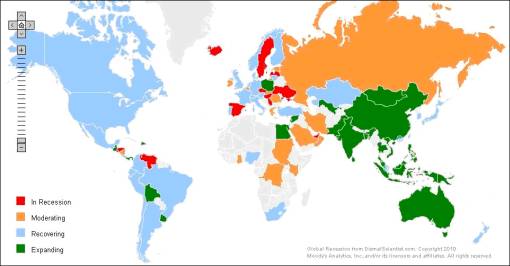
Source: Dismal Scientist
“Global businesses remain cautious. They are no longer panicked as they were a year ago, but they still have yet to regain the confidence that prevailed prior to the financial crisis and Great Recession. Businesses are upbeat when broadly assessing current conditions and the outlook through this summer. They are much less sanguine when responding to specific questions regarding the strength of sales, hiring and inventories,” according to the results of the latest Survey of Business Confidence of the World by Moody’s Economy.com. As has been the case since the beginning of the global economic recovery in the middle of 2009, South Americans are the most upbeat and North Americans the most nervous. Confidence is strongest among financial firms and weakest among those that work in real estate and government.
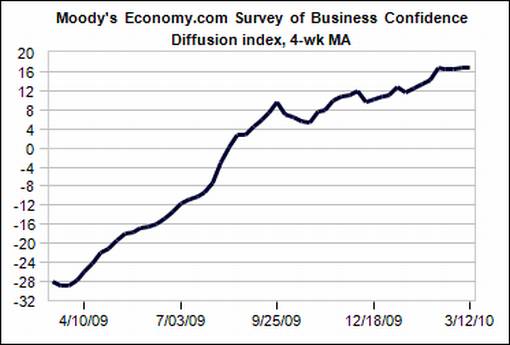
Source: Moody’s Economy.com
Meanwhile, German investor confidence fell in March for the sixth consecutive month. The ZEW indicator of economic sentiment dropped to 44.5, its lowest level since July 2009, from 45.1 in February. Investor confidence has been weighed down by concerns about large budget deficits in other eurozone member countries such as Greece.
The Bank of Japan (BoJ) last week adopted further monetary easing by doubling the size of a liquidity program for banks, whereas Brazil kept its monetary policy unchanged. However, as inflationary pressures start to build, the Reserve Bank of India increased interest rates for the first time since July 2008.
A snapshot of the week’s US economic reports is provided below. (Click the links to see Northern Trust’s assessment of the various data releases.)
Friday, March 19
• US debt holdings of foreign central banks continue to grow
Thursday, March 18
• Contained consumer prices supportive of easy monetary policy
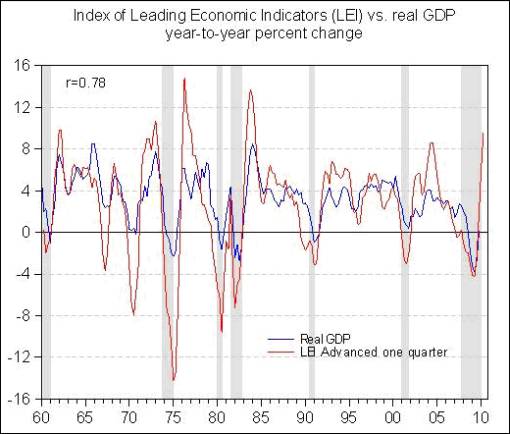
• Index of Leading Indicators - projection of economic growth remains intact
• Total continuing claims persist at high level
Wednesday, March 17
• Effective federal funds rate is moving closer to target federal funds rate
• Lower energy prices account for dip in Wholesale Price Index
• Housing market update - Mortgage Purchase Index
Tuesday, March 16
• FOMC policy statement - Fed is optimistic about labor market compared with view in January
• Construction of new homes standing still - will activity pick up soon?
Monday, March 15
• Factory production declined, weather may have played a role
• Decline of Housing Market Index is Troubling
Commenting on the growth outlook for the US economy, Asha Bangalore (Northern Trust) said: “The Conference Board’s Index of Leading Economic Indicators (LEI) increased 0.1% in February after a 0.3% increase in the prior month. On a year-to-year basis, the January-February average shot up 9.6%, which exceeds the high recorded in the 2001-2007 expansion. The main takeaway is that projections of economic growth remain in place.”
The article continues here
By Dr Prieur du Plessis
Dr Prieur du Plessis is an investment professional with 25 years' experience in investment research and portfolio management.
More than 1200 of his articles on investment-related topics have been published in various regular newspaper, journal and Internet columns (including his blog, Investment Postcards from Cape Town : www.investmentpostcards.com ). He has also published a book, Financial Basics: Investment.
Prieur is chairman and principal shareholder of South African-based Plexus Asset Management , which he founded in 1995. The group conducts investment management, investment consulting, private equity and real estate activities in South Africa and other African countries.
Plexus is the South African partner of John Mauldin , Dallas-based author of the popular Thoughts from the Frontline newsletter, and also has an exclusive licensing agreement with California-based Research Affiliates for managing and distributing its enhanced Fundamental Index™ methodology in the Pan-African area.
Prieur is 53 years old and live with his wife, television producer and presenter Isabel Verwey, and two children in Cape Town , South Africa . His leisure activities include long-distance running, traveling, reading and motor-cycling.
Copyright © 2010 by Prieur du Plessis - All rights reserved.
Disclaimer: The above is a matter of opinion and is not intended as investment advice. Information and analysis above are derived from sources and utilizing methods believed reliable, but we cannot accept responsibility for any trading losses you may incur as a result of this analysis. Do your own due diligence.
Prieur du Plessis Archive |
© 2005-2022 http://www.MarketOracle.co.uk - The Market Oracle is a FREE Daily Financial Markets Analysis & Forecasting online publication.