Fastest Economic Recovery Ever Could Push Corporate Profits to Record Highs 2010
Stock-Markets / Corporate Earnings Mar 22, 2010 - 05:16 AM GMTBy: Money_Morning
 Jon D. Markman writes: Sometimes we get a little carried away talking about esoteric subjects like bulls, bears, supply, demand, moving averages and the like. But if you just want to focus on something real, then look at corporate profits. When they're rising from a low, that's good; when they're flat-lining or declining, that's bad. Pretty simple.
Much of the rally of the past year has been in anticipation of a profit recovery. And now that recovery is actually coming in a bit better than bulls expected, which is why they are able to elbow bears so effectively. ISI Group now figures that corporate profits will clock in at +38.8% for the first quarter (year over year) of 2010, then +42.4% in the second quarter, +36.8% in the third quarter and then +30% in the fourth quarter (against harder comparisons). That would put profits in 2010 up a record 36.1% overall.
ISI's regression model gets its profits forecasts from a combination of unit labor costs, the Organization for Economic Development (OECD) leading economic indicator, junk bond yields and the yield curve. Using a proprietary formula, they whip this recipe of inputs and forecasts together to create a model that has led profits closely since 1992. Right now the model is running right on target, with a little extra boost from lower-than-expected unit labor costs (i.e., fewer employees and lower wages).
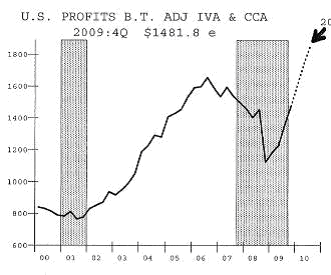
If profits increase by that much in 2010, ISI analysts forecast they will hit $1.86 trillion by the third quarter of this year, which would be a record by a wide margin, as you can see in their chart, above.
Why is this important? ISI reports that in the 1930s it took U.S. profits 12 years to hit a new high after crashing in the early part of the decade. In Japan's lost decades, it took 16 years.
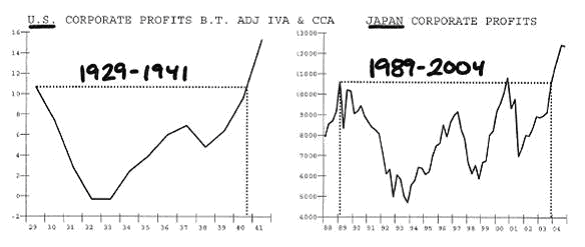
In the United States it is now projected that profits will hit a new high in 2010, which is just four years from their prior peak. This information helps us understand that the current rebound is unique in its robustness relative to prior recoveries in the past century, most likely because of the united front put forward by governments and central banks to stimulate on a vast scale.
Mood Change Coming?
Stocks enjoyed an uneventful, low volatility stretch over the past five days, as the major indexes of large U.S. companies rose by 0.25 to 0.8% and most major overseas indexes fell by a fraction. Only a couple special emerging markets rang the bell with outsized gains: Market Vectors Indonesia Index ETF (NYSE: IDX) and i-Shares MSCI Turkey Index Fund (NYSE: TUR) each rose by 2.5%. More on this later this week.
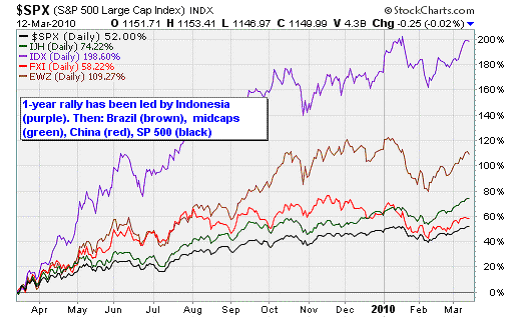
In the "how about that?" category, I have to give props to iShares S&P US PREFERRED IDX Fund ETF (NYSE: PFF) because not only did this group of hybrid securities gain 3.5% so far in March, but they also yield 7.9% in dividends and have a very low-volatility profile. Got to love that. Also gaining more than you would imagine was Alerian MLP Index (NYSE: AMZ.X), which provides easy access to the high-yielding master limited partnerships; it has risen 3.2% this month, and yields 5.5% a year to boot.
For the past month, I've said that bull has to push the S&P 500 over 1,115 and stick it there for a week to obtain credibility. Their next job was to push the index to the January high of 1,150. And finally they needed to push riskier stocks even higher than their January peaks to show that they were willing to gamble a bit, the prerequisite for every bull cycle. So, mission accomplished.
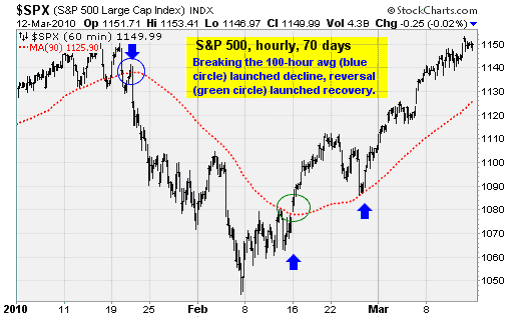
As you can see, the 100-hour moving average of the S&P 500 has proven to be a great guide, just as it was in March 2009. When the 100-hour (15-day) average was broken on the downside in January, all hell broke loose; when it was broken to the upside, the recovery was fully launched. Remember to keep an eye on this measurement of short-term sentiment going forward.
All of this was achieved against the backdrop of more muted news on the European financial crisis. Greece made all the necessary gestures and statements to make its eurozone overseers in Brussels believe that it had embarked on the fiscal austerity measures necessary to pay down its debts, and Germany and France leaders issued veiled statements that they accept Athens' pledges at face value.
Now as we move into the final week and a half of March, the battle plans and mood are set to change. Stocks are not as cheap as they were in early February, so even bulls might find it harder to buy. And bears now realize their backs are against the wall, so they should be expected to fight harder than ever.
Meanwhile, the Europeans are meeting again next week on the Greek crisis, and while it is fairly certain that Athens' debts will be at minimum guaranteed, the demands put on them by Brussels might be seen as so onerous as to be impossible to enforce.
In short, you could say that the easy money off the February low has been made and now we will re-enter a period of trench warfare in which buyers and sellers are motivated more by the staccato release of economic data and first-quarter earnings pre-announcements.
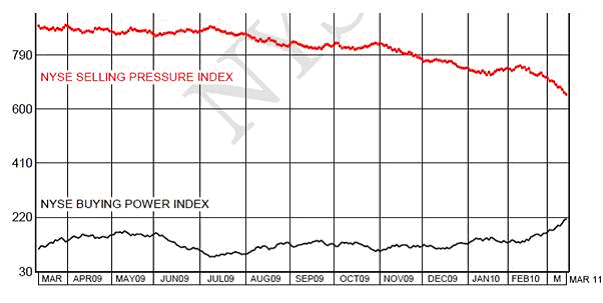
This is the moment when an analysis of underlying stock market demand and supply becomes valuable. And here's what we find, in part courtesy of our friends at Lowrys Research Corp.
-- Buying power, or demand, hit a new rally high (off the March 2009 bottom) in the past week. That is consistent with the expansion of a healthy rally.
-- Selling pressure, or supply, hit a new rally low early in the past week.
Every major top in the market in the past century has been predated at least two to three months of steady decline in demand and rise in supply, and usually more like six or seven months. Quite the opposite is happening now, since on March 9-10 came the largest two-day rise in demand and drop in supply since the March 2009 bottom, according to Lowrys analysis. That's the opposite of the kind of behavior that would occur if the balance of power were shifting to sellers.
Moreover you know that I always mention the ratio of rising to falling stocks every day. These advance/decline stats, which measured across months, registered a new rally high in the past week, which is another measure of continued enthusiasm for stocks among institutions. Also, new NYSE highs, which typically top out a year prior to a major market top, is running at the same level as its October peak.
Put it all together, and the evidence suggests that while bears may get the upper hand from time to time following a negative economic report or surprise earnings disappointment from a major company, the tide of expanding demand continues to favor buyers. This week will be choppy, but look for bull to defend the 1,115 to 1,123 area if it comes to that.
Week in review:
Monday: Industrial production came in slightly ahead of expectations for February by rising 0.1%. Analysts expected no change. But the increase was mainly tied to increased output at utilities due to weather. The manufacturing sector continues to show strength, with the Empire State Manufacturing survey indicating increases in new orders, shipments, delivery times, and employment.
Tuesday: Stocks pushed to new highs today after the Federal Reserve left interest rates unchanged. But that wasn't the real story. The real story surrounded the Fed's plans for all those special lending vehicles and liquidity programs created in the depths of the financial crisis. The closing of those efforts marks the transition from crisis and recession to policy normalization and economic stabilization.
Wednesday: Inflation pressures remain subdued with the Producer Price Index falling 0.6% in February. This is a big reversal from January's 1.4% spike -- which was due to 5.1% jump in energy costs. Lower inflation will allow the Fed to keep rates lower longer as it nurses the economy back to health.
Thursday: Another flat reading on inflation, with the Consumer Price Index coming in unchanged for February. Weak shelter costs associated with a soft housing market continuing to keep a lid on rising prices. There were also price declines in the apparel and recreation categories.
Friday: Stocks moved lower on fresh concerns over a rescue package for Greece. Also, the Reserve Bank of India imposed a surprise 0.25% interest rate hike -- fueling worries over a tightening of monetary policy in the emerging market economies. This was the first rate increase since July of 2008. The Indian central bank left open the possibility of additional rate increases as it battles rising inflation.
The week ahead:
Monday: No major economic releases.
Tuesday: Existing home sales for February will be released. Analysts expect a slight month-over-month decrease to a five million seasonally-adjusted annual rate. This is well below the 6.5 million annual rate seen in November. Optimists are hopeful that the upcoming April expiration of the once-extended first-time homebuyer tax credit will encourage another surge of sale activity.
Wednesday: Durable goods orders for February will be reported. Analysts expect a 1% increase to build on the 2.6% gain in January. New homes sales for February will also be reported. After a sharp 11.2% drop in January, following a 3.9% drop in December, analysts are expecting a slight month-over-month increase despite the difficult winter weather seen in February.
Thursday: Weekly initial jobless claims are expected to decline slightly to 450k from 457k in the previous week.
Friday: The government's final numbers for fourth quarter GDP will be released. Analysts expect no change from the revised 5.9% growth rate. Also, we'll get a read on consumer sentiment courtesy of the University of Michigan.
Source:http://moneymorning.com/2010/03/22/corporate-profits-2/
Money Morning/The Money Map Report
©2010 Monument Street Publishing. All Rights Reserved. Protected by copyright laws of the United States and international treaties. Any reproduction, copying, or redistribution (electronic or otherwise, including on the world wide web), of content from this website, in whole or in part, is strictly prohibited without the express written permission of Monument Street Publishing. 105 West Monument Street, Baltimore MD 21201, Email: customerservice@moneymorning.com
Disclaimer: Nothing published by Money Morning should be considered personalized investment advice. Although our employees may answer your general customer service questions, they are not licensed under securities laws to address your particular investment situation. No communication by our employees to you should be deemed as personalized investment advice. We expressly forbid our writers from having a financial interest in any security recommended to our readers. All of our employees and agents must wait 24 hours after on-line publication, or 72 hours after the mailing of printed-only publication prior to following an initial recommendation. Any investments recommended by Money Morning should be made only after consulting with your investment advisor and only after reviewing the prospectus or financial statements of the company.
Money Morning Archive |
© 2005-2022 http://www.MarketOracle.co.uk - The Market Oracle is a FREE Daily Financial Markets Analysis & Forecasting online publication.


