Wall Street and Main Street Are Joined at the Hip
Economics / US Housing Aug 15, 2007 - 09:45 AM GMTBy: Paul_L_Kasriel
Watching Bubblevision and reading the Wall Street Journal (see August 7 edition, " Don't Panic About the Credit Market ," David Malpass), I keep hearing that what happens on Wall Street doesn't materially affect Main Street. I respectfully disagree. Main Street is more dependent on Wall Street than ever before.
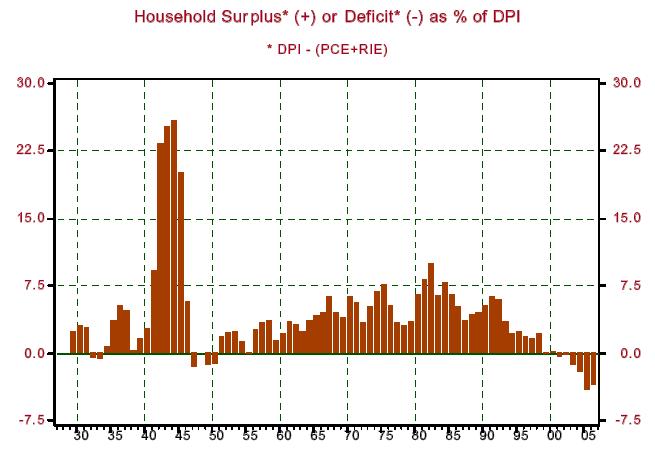
Chart 1 shows the history of one simple definition of household surpluses and deficits. This definition subtracts the sum of Personal Consumption Expenditures (PCE) and Residential Investment Expenditures (RIE) from Disposable Personal Income (DPI). Both PCE and RIE are "line items" in the Gross Domestic Product accounts. RIE is essentially the value-added in the private residential real estate sector - new construction of homes, including remodeling of existing homes, and the value added by real estate brokers. DPI is equal to all income currently earned by households, including employer contributions to pension funds, interest on investments, dividends on corporate equities and rents on property less taxes paid by households.
From 1929 through 2006, there were only 13 years in which households incurred deficits - i.e., spent more in total than they earned after taxes. Two of these household-deficit years occurred during the Great Depression of the 1930s, three occurred shortly after the end of World War II and one occurred in 1955. The remaining seven household-deficit years occurred in 1999 and 2001 through 2006. Three things to note: (1) that households have run deficits in six out of the past seven years is unprecedented; (2) the magnitude of the 2004, 2005 and 2006 household deficits are unprecedented, and; (3) the household deficits starting in 1999 occurred in a period when asset prices showed extraordinary increases.
Chart 1
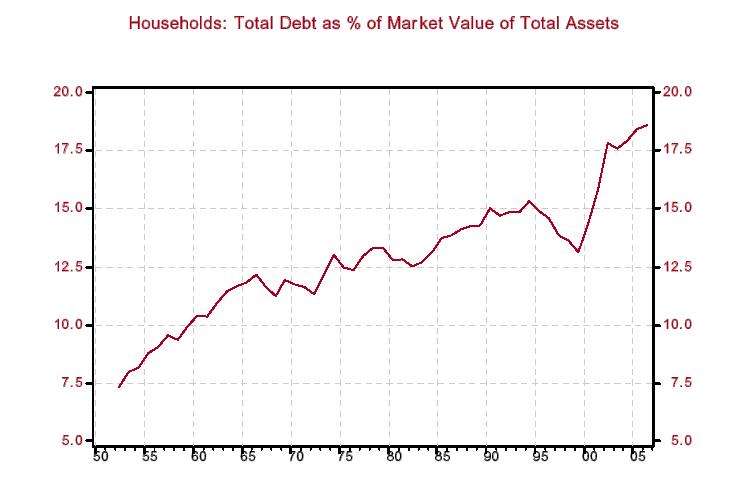
There are only two ways that the household sector, or any other sector, for that matter, can run a deficit - either borrow and/or sell assets to another sector. Chart 2 shows that household borrowing relative to DPI started rising sharply about the time households began running deficits in recent years, hitting a record high in 2005. Chart 3 shows that as household borrowing rose in recent years, a rising proportion of that household borrowing was mortgage-related. In fact, as shown in Chart 4, the leverage of owner-occupied residential real estate has never been higher. And lest you think that households just substituted mortgage debt for other kinds of debt, Chart 5 shows that total household debt as a percent of the market value of total household assets also is at a record high.
Chart 2
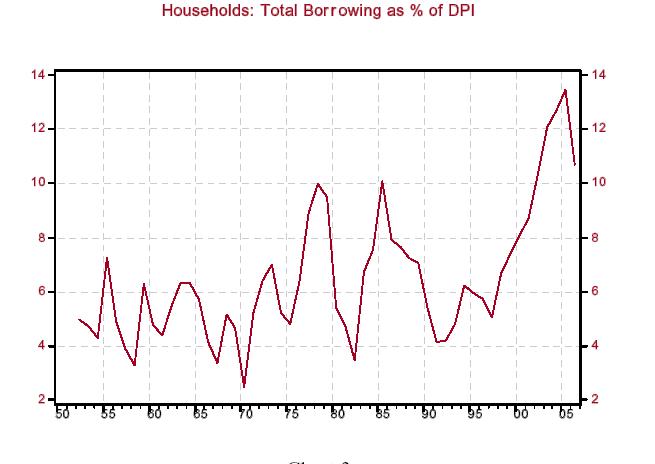
Chart 3
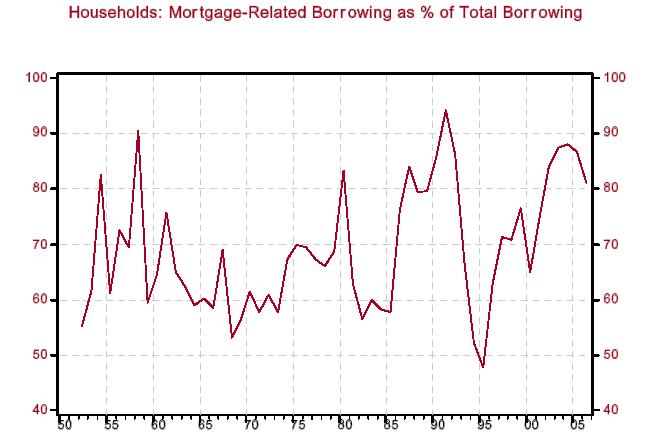
Chart 4
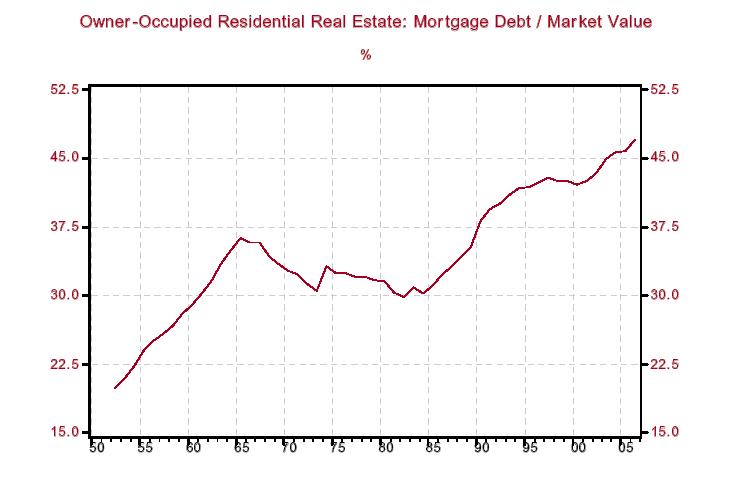
Chart 5
It is clear, then, that one avenue of funding for recent household deficit spending is increased borrowing, in general, and mortgage-related borrowing, in particular. A large part of the mortgage borrowing has helped finance the purchases of houses. But mortgage-related borrowing most likely has been used to finance purchases of consumer goods and services. Because funds are fungible, there is no direct evidence of this. But we can infer that households have been using mortgage-related borrowing to help fund consumer spending.
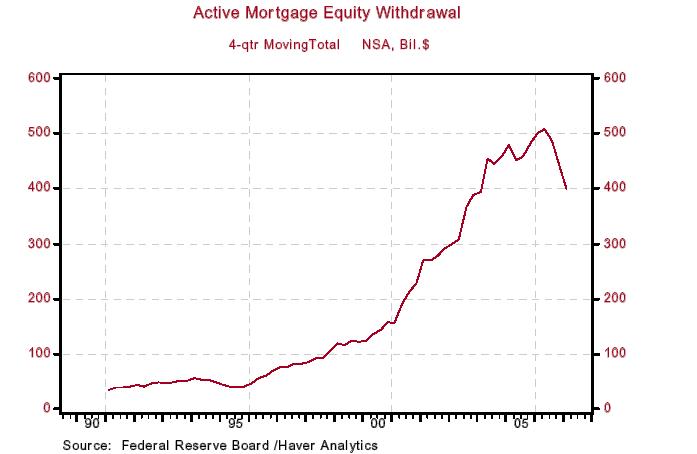
Chart 6 shows that in recent years, PCE as a percent of DPI has risen to the highest levels since the Great Depression. Increases in mortgage equity withdrawal (MEW) - the refinancing of mortgages into larger mortgages in order to extract equity from one's house - coincided with this recent upward trend in the average propensity to consume. Chart 7 shows the behavior of MEW. ( Active MEW can be defined as mortgage equity withdrawal consisting of refinancing and home equity borrowing.)
Chart 6
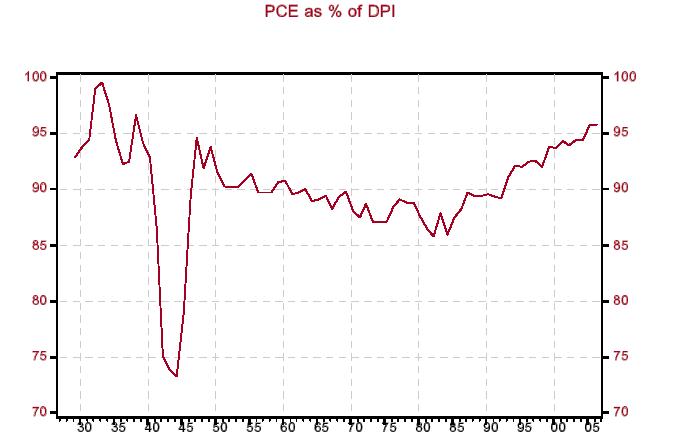
Chart 7
For what purpose might homeowners have been borrowing against the equity in their houses? Perhaps to remodel a kitchen. That would not be counted in PCE but in RIE. But again, funds are fungible. Had not households been able to borrow against the equity in their houses, they might not have been able to increase their consumer spending as much if they still wanted to remodel the kitchen.
Perhaps households were borrowing against the equity in their houses, a relatively cheap source of household credit given the nature of the underlying collateral, in order to reduce other more "expensive" household debt. Perhaps. But given that total household borrowing relative to DPI rose to record levels in recent years and given that total household debt is at a record level relative to the market value of total household assets, it is obvious that households were taking on more mortgage debt than they were retiring of other kinds of debt.
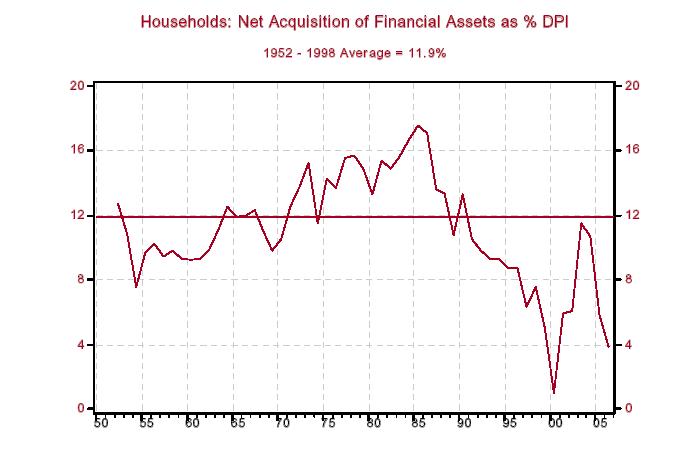
Perhaps, as Malpass suggests, households were borrowing against the equity in their houses to fund the acquisition of financial assets - stocks, bonds, deposits, money market mutual funds. Chart 8 shows household net acquisition of financial assets as a percent of DPI. The average over the years 1952 through 1998 - the years before households began running serial deficits - is 11.9%. The average over the years 1999 through 2006 - the years when households ran serial deficits - is 6.2%. In only two of these eight years did household net acquisition of assets relative to DPI get even close to the 1952-through-1998 average - 2003 (11.5%) and 2004 (10.7%). So, there is scant evidence that households were borrowing in the mortgage market to fund purchases of financial assets. Moreover, had they not borrowed so much, they might have had to consume less in order to purchase financial assets. Again, funds are fungible.
Chart 8
What does all this have to do with Wall Street and Main Street? Now that mortgage underwriting standards are tightening dramatically and risk aversion toward mortgage-related securities has increased, the effective cost of mortgage credit has increased. This will mean that the contraction in home sales will persist. In turn, this will result in a continued decline in house prices. The decline in house prices implies that the growth in home equity will slow. Therefore, home equity available for extraction will increase at a slower pace, if at all. Moreover, with tighter mortgage underwriting standards, fewer homeowners will qualify to refinance their mortgages in order to tap the equity in their houses for the purchases of flat screen televisions and SUVs. So the tremors on Wall Street related to the mortgage markets will be felt on Main Street.
The other avenue for households to fund their deficits is to sell assets to another sector. And, in fact, households have been net sellers of assets - specifically, corporate equities. Chart 9 shows household net acquisition of the sum of corporate equities directly and mutual funds. The granularity of the data does not allow for determining what amount of underlying mutual fund assets are corporate equities or other types of securities. Let's assume for the sake of argument that the underlying assets of all the mutual funds purchased by households were corporate equities.
Based on this assumption, households more often than not are net sellers of corporate equities. Relative to DPI, from 1952 through 1998, years before households began running serial deficits, the average household net acquisition of corporate equities as a percent of DPI was minus 0.5%. Beginning in 1999 through 2006, when households began running serial deficits, there was only one year when they made a positive net acquisition of corporate equities: 2003. Their net acquisition of corporate equities relative to DPI in the years 1999 through 2006 - years in which households began running serial deficits - averaged minus 2.4%. So, in recent years, households sold, on net, historically large amounts of corporate equities, which helped fund their deficits.
Chart 9
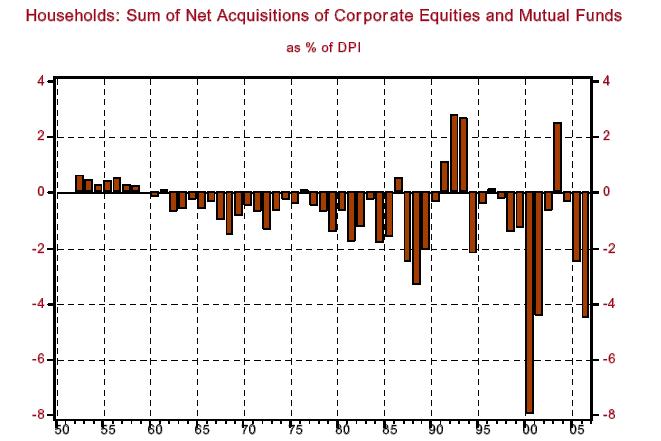
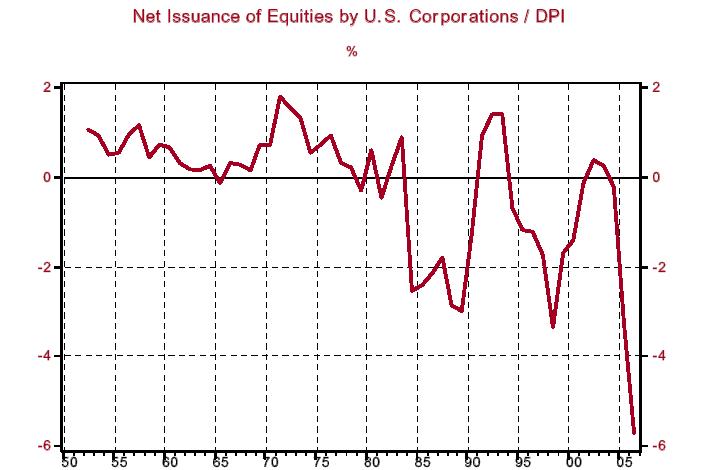
Chart 10 shows the net issuance of corporate equities by U.S. corporations as a percent of DPI. In 2005 and 2006, when households were running record deficits, record absolute and relative amounts of U.S. corporate equities were "retired." So, U.S. households have been net sellers of equities, and U.S. corporations have been net buyers. (Foreign entities also have been net buyers, but this is not relevant to the argument at hand.)
Chart 10
To repeat, what does all this have to do with Wall Street and Main Street? Chart 11 shows that nonfinancial corporations, which have been the principal net "retirers" of corporate equities compared to financial corporations, stepped up their credit market borrowing relative to their capital spending in recent years. This implies that nonfinancial corporations have increased the use of debt to help fund their record amount of stock buybacks. I do not have data on private-equity syndicate borrowing. But my understanding is that private-equity syndicates have borrowed massive amounts of funds in recent years to fund their buyouts of publicly traded corporations. So the entities to which households have been primarily selling corporate equities - the corporations themselves and private-equity syndicates - have been relying on relatively cheap credit to finance these buybacks and buyouts.
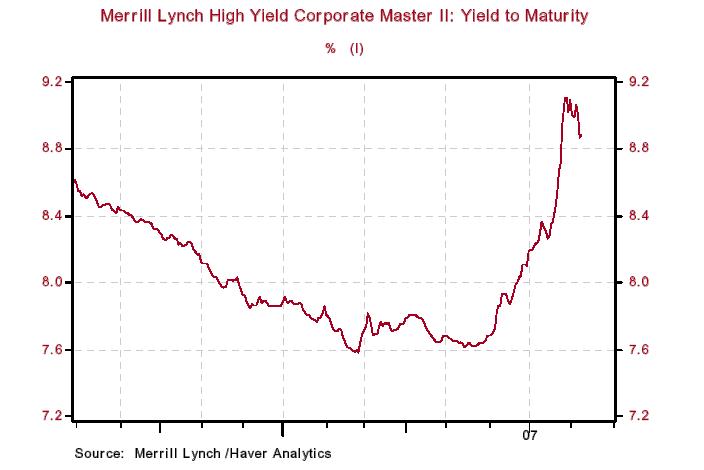
But as Chart 12 shows, corporate credit is getting more expensive as bond investors become more risk averse. If this bond-market risk aversion persists and/or increases, it could sharply curtail stock buybacks and corporation buyouts. This, in turn, would reduce a source of funding of household deficit spending - household net sales of corporate equities.
Chart 11
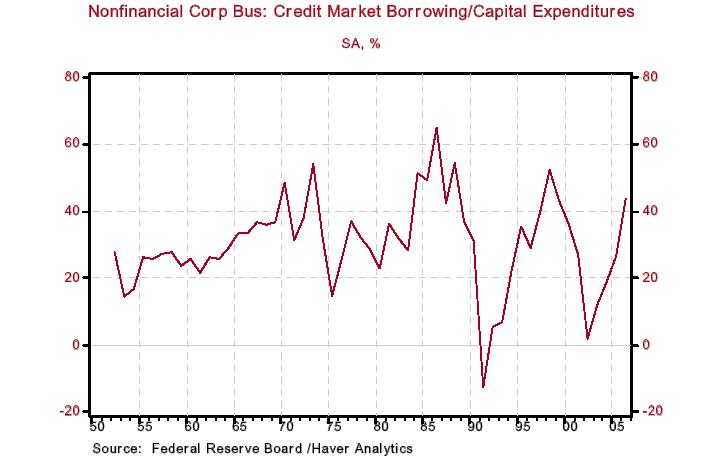
Chart 12
In sum, Main Street is very dependent on Wall Street these days to fund Main Street's deficit spending. They are joined at the hip. If Wall Street is encountering difficulties, then Main Street will, too.
Paul Kasriel is the recipient of the 2006 Lawrence R. Klein Award for Blue Chip Forecasting Accuracy
By Paul L. Kasriel
The Northern Trust Company
Economic Research Department - Daily Global Commentary
Copyright © 2007 Paul Kasriel
Paul joined the economic research unit of The Northern Trust Company in 1986 as Vice President and Economist, being named Senior Vice President and Director of Economic Research in 2000. His economic and interest rate forecasts are used both internally and by clients. The accuracy of the Economic Research Department's forecasts has consistently been highly-ranked in the Blue Chip survey of about 50 forecasters over the years. To that point, Paul received the prestigious 2006 Lawrence R. Klein Award for having the most accurate economic forecast among the Blue Chip survey participants for the years 2002 through 2005.
The opinions expressed herein are those of the author and do not necessarily represent the views of The Northern Trust Company. The Northern Trust Company does not warrant the accuracy or completeness of information contained herein, such information is subject to change and is not intended to influence your investment decisions.
Paul L. Kasriel Archive |
© 2005-2022 http://www.MarketOracle.co.uk - The Market Oracle is a FREE Daily Financial Markets Analysis & Forecasting online publication.


