Gold and Silver Long-term Buy Signals Triggered
Commodities / Gold and Silver 2010 Apr 01, 2010 - 04:21 PM GMTBy: Steven_Vincent

 I am placing gold and silver on official long term buy signals as of today. The commodities complex in general is breaking out across the board in spite of continued resilience in the US dollar and in general world markets are flashing an inflationary growth profile.


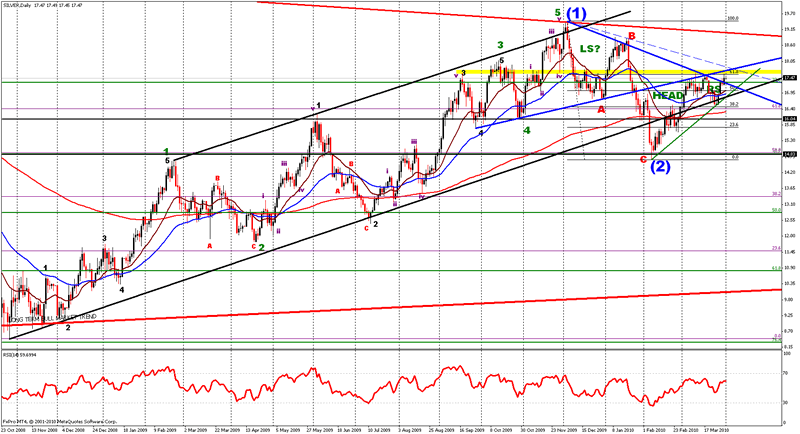
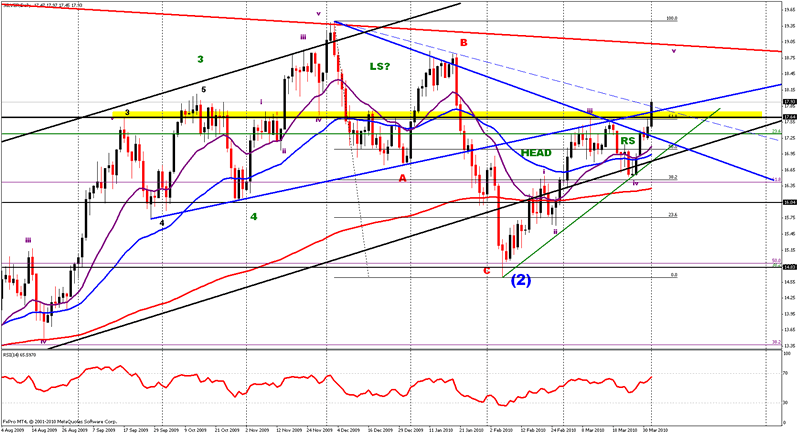
We can see that a reverse head and shoulders breakout has occurred and that important horizontal price resistance has been overcome. We can also see that the breakdown from the head and shoulders pattern that developed from September-January (and which many technical analysts noted fearfully--myself included) has failed and together with reversal of the trend channel failure is leaving behind a very bullish double bear trap.
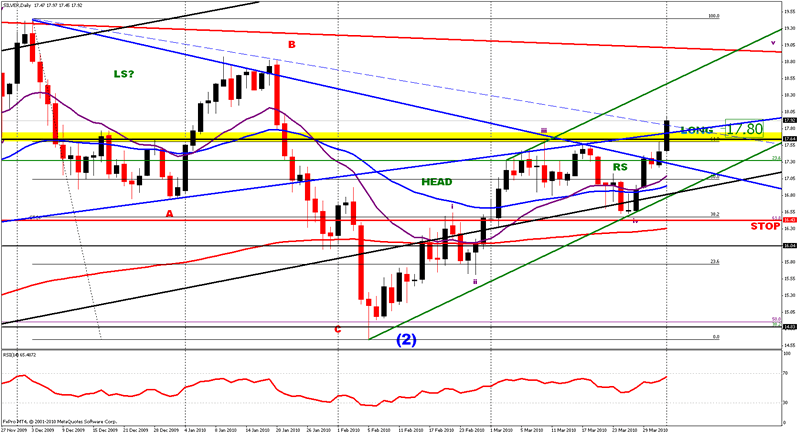
Here's a closer view of the reverse head and shoulders which includes today's price action:

We can see that silver is now in wave v of the first wave of Wave (3) from the Wave (2) low. That should complete in the vicinity of the downtrend (red) from the $21.35 high.
Of note is the bullishly smaller right shoulder and the fact that this pattern is almost entirely unrecognized. The distance from the head to the neckline added to the neckline breakout gives us a completion target of $20.96 for Wave (3). That will give bears a chance to call for a double top during the Wave (4) correction which may potentially develop there. On the other hand, this could be an extended Wave (3).
Also of technical significance is that the neckline breakout occurred precisely at the 23.6 Fibonacci retracement level of the entire bull market in silver. Today price reclaimed the 61.8 Fibonacci retracement of the decline from the Wave (1) high. All moving average in all time frames are bullishly aligned and rising together. Hourly RSI is somewhat overbought so look for small pullbacks on the hourly chart to enter a position.
We should enter long now with the knowledge that short term there may be a pullback against our position. This is a long term position trade, not a swing trade (though we may swingtrade to take profits and add to our position along the way). Our stop level is a close below the 61.8 Fibonacci retracement level of the decline off the major top at $21.35, which also corresponds with the 31.8 Fibonacci level off the Wave (1) high as well as the bottom of the recent minor wave iv at $16.43. A close there will tell us that this analysis is wrong and we should exit our position at a loss right away.
Generally these reports as well as twice weekly video reports are prepared for BullBear Trading Service members and then released to the general public on a time delayed basis. To get immediate access just become a member. It's easy and currently free of charge.

Disclosure: No current positions.
By Steve Vincent
The BullBear is the social network for market traders and investors. Here you will find a wide range of tools to discuss, debate, blog, post, chat and otherwise communicate with others who share your interest in the markets.
© 2010 Copyright Steven Vincent - All Rights Reserved Disclaimer: The above is a matter of opinion provided for general information purposes only and is not intended as investment advice. Information and analysis above are derived from sources and utilising methods believed to be reliable, but we cannot accept responsibility for any losses you may incur as a result of this analysis. Individuals should consult with their personal financial advisors.
© 2005-2022 http://www.MarketOracle.co.uk - The Market Oracle is a FREE Daily Financial Markets Analysis & Forecasting online publication.


