


Gold, Time to Get Excited Again?
Commodities / Gold and Silver 2010 Apr 04, 2010 - 01:14 PM GMTBy: Merv_Burak

 Is it time to get all excited again? Not yet. Gold has had a couple of good days but has yet not breached any major resistance levels so the move may only be temporary within a basic lateral trend. Let’s wait for better validation of the up move.
GOLD : LONG TERM
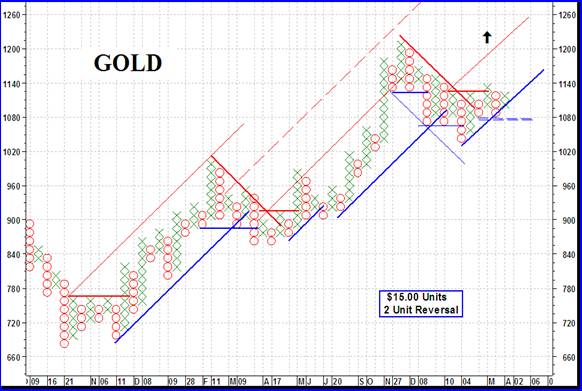
Little by little as I present these point and figure charts and talk about their construction and criteria I hope some of the conversation will be absorbed by readers and over time you will have a good understanding (and appreciation) of point and figure charts. I no doubt will be repeating myself but that’s bound to happen. Today I’ll just mention the trend lines. My usual (about 99% of the time) trend lines are referred to as the 45 degree lines. To make the chart more presentable the units are often skewed and their height and width may not be the same. Therefore my definition of the 45 degree trend lines are lines whose slope is the slope of a line drawn from the center of one unit to the center of the next unit which may be one unit higher (up trend) or one unit lower (down trend). When the height and width of a unit are exactly the same size we then have a true 45 degree slope, otherwise the slope is slanted accordingly.
The thick solid lines are primary trend or support/resistance lines. The thinner the line the more secondary is the line. Red lines are down trend or resistance lines. The blue lines are up trend or support lines. There is some confusion about those up trending resistance (red) lines or down trending support (blue) lines. The up trend resistance lines are drawn from the wall of Os to the left of the break out point while the down trend support lines are drawn from the wall of Xs to the left of the break down point. Enough of this week’s space filler.
Looking at the P&F chart we have a bullish break-out at the $1040 level with an initial projection to the $1230 level. This is only a potential 8% move and indicates a very weak break-out at this time. So, although we do have a bullish break it needs watching for any surprises ahead. Of course, we have better projections from other earlier breaks so let’s hope those projections rule.
As for the usual indicators, nothing much has changed from the long term perspective. The price of gold remains above its positive sloping long term moving average line and the momentum indicator remains in its positive zone above a now positive trigger line. The volume indicator continues to move up and down but in a basic lateral direction. On the Friday close it is above its slightly positive trigger line. Although the volume indicator is tracking a basic lateral trend it does have an upward bias and is slightly higher than its level over the past couple of months. The long term rating remains BULLISH.
INTERMEDIATE TERM
The intermediate term is a little brighter than last week. Gold has once more moved above its intermediate term moving average line and the line has just turned to the up side. The momentum indicator crossed into its positive zone the previous week and remained there during this week. It is also above its now positive trigger line. The volume indicator remains above its positive trigger line. On the intermediate term we are back to a BULLISH rating.
SHORT TERM
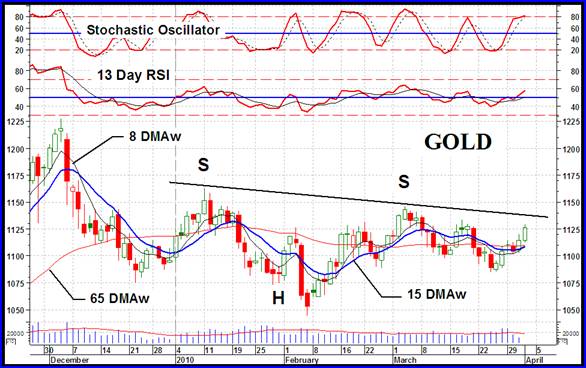
The short term continues to look bright. All the indicators are in the right direction although the very short term may be a problem. We have a head and shoulder pattern on the short term chart. As mentioned in the past I’m not fully into this being an H&S pattern because I’d like to see a significant move into the pattern. My criteria for such a move are just short of being met here but the pattern is well drawn so let’s see what happens next.
Gold continues to move higher above its positive sloping short term moving average line. The momentum indicator is moving higher in its positive zone and is above its positive trigger line. The daily volume activity is a problem these past couple of days but that could just be speculators going on early Easter holiday. The short term rating is BULLISH and the very short term moving average line has confirmed the rating by just moving above the short term line.
As for the immediate direction of least resistance, that would still be to the up side but with some caution. The aggressive Stochastic Oscillator has moved into its overbought zone and seems to be in the process of turning around. We’ll have to wait and see what it does on Monday as it could drop below its overbought line for a trend reversal warning.
SILVER
Silver performance this past week was far better than that of gold. It is now at new recovery highs from its lows in early Feb. We could use a little better upside volume action but that may come. Silver seems to be where one should look as far as speculation is concerned.
If one were looking at silver stocks one should avoid the top quality ones. My Merv’s Qual-Silver Index of the 10 largest silver companies is only half way to its previous high from 2008 while the 25 Merv’s Spec-Silver Index stocks are at new all time highs with double the weekly performance of the Qual-Silver Index this past week.
Looking at the performance of silver itself, one can plainly see the better performance here. Unlike gold where the short term moving average line has not yet breached above the intermediate term line, for silver that breach came a few weeks ago and the short term moving average line remains above the intermediate term line for continuing confirmation of the positive trend. What more can one say, all the time periods are BULLISH.
PRECIOUS METAL STOCKS
I keep mentioning the Merv’s Penny Arcade Index here. As long as that Index is still positive the long term bull market in gold and silver stocks is expected to continue. So it goes for another week. That doesn’t mean there are not some warning signs of weakness in the Penny Arcade Index but nothing serious yet and nothing really of note. The Index continues to be a top performer in all three time periods although the short term performance fluctuates quite a bit. To be accurate this week’s performance was due almost exclusively to the performance of one stock which advanced 62.5% and gave the Index a gain of 2% by itself. This stock was highlighted to subscribers a few months back and still has a P&F projection for another potential 500% move ahead. However, this is what happens with the penny stocks, they do not all move in concert but sort of take turns moving.
As for the universe as a whole, gold stocks were ahead by 3.8% this week while the quality sector was ahead 5.8%. The major North American Indices were up in the 6% to 7% area. Two quality stocks had good upside moves and with the weighting these Indices apply, that would have given their Indices the slightly better performance versus the average stock performance of the Merv’s Qual-Gold Index. The major North American Indices are still below their March highs. Of the 8 Merv’s Indices only the Merv’s Qual-Silver Index is below its March high. The Merv’s Gamb-Gold Index is into new recovery highs and the Merv’s Spec-Silver Index is into new all time highs. These may be the sectors to concentrate your speculation on.
Merv’s Precious Metals Indices Table
Well, that will be it for this week.
By Merv Burak, CMT
Hudson Aero/Systems Inc.
Technical Information Group
for Merv's Precious Metals Central
For DAILY Uranium stock commentary and WEEKLY Uranium market update check out my new Technically Uranium with Merv blog at http://techuranium.blogspot.com .
During the day Merv practices his engineering profession as a Consulting Aerospace Engineer. Once the sun goes down and night descends upon the earth Merv dons his other hat as a Chartered Market Technician ( CMT ) and tries to decipher what's going on in the securities markets. As an underground surveyor in the gold mines of Canada 's Northwest Territories in his youth, Merv has a soft spot for the gold industry and has developed several Gold Indices reflecting different aspects of the industry. As a basically lazy individual Merv's driving focus is to KEEP IT SIMPLE .
To find out more about Merv's various Gold Indices and component stocks, please visit http://preciousmetalscentral.com . There you will find samples of the Indices and their component stocks plus other publications of interest to gold investors.
Before you invest, Always check your market timing with a Qualified Professional Market Technician
Merv Burak Archive |
© 2005-2022 http://www.MarketOracle.co.uk - The Market Oracle is a FREE Daily Financial Markets Analysis & Forecasting online publication.