Predicting All Major Stock Market Crashes Since 1965!
Stock-Markets / Financial Crash Apr 08, 2010 - 03:42 AM GMTBy: Francois_Soto
 Discovery
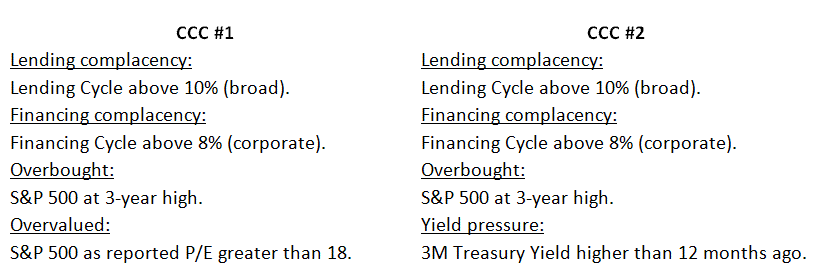
We unexpectedly discovered two sets of conditions preceding every major S&P 500 peak since 1965! We coined such signal the imminent Credit Complacency Crash - CCC. When these two sets occur, it always (so far) caused major stock market crashes. We define a crash as a decline of more than -15%.
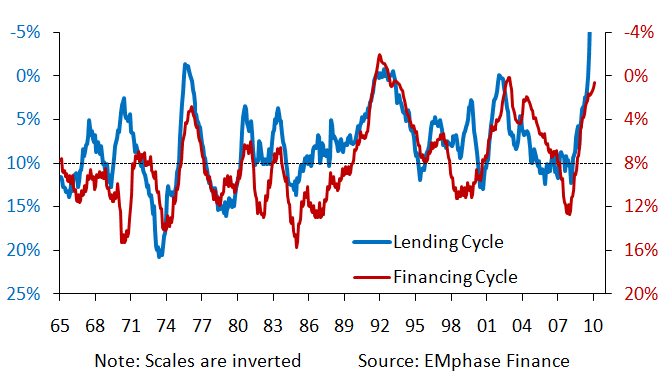
We believe our CCC model could have direct applications mostly in tactical asset allocation and risk management for institutional clients. How did we discover this innovative model? This time, we had the intuition of back testing both our Lending Cycle and Financing Cycle anticipatory indicators.
Both of these anticipatory indicators lead CB LEI Y/Y by at least 12 months. Given the S&P 500 Y/Y lead Real GDP Y/Y by 3-6 months and CB LEI Y/Y had a consistent lead of 3 months over Real GDP Y/Y, we can estimate having between 6-9 months of lead on the S&P 500 when we combine both these indicators.

Conditions

Before we display our results, take note we observed these two sets of conditions on a monthly closing basis. We used S&P 500 data as reference. We trailed all these signals for six months except for the P/E in order to match sub-signals. We also eliminated multiple signals by only taking the first signal given.
Results
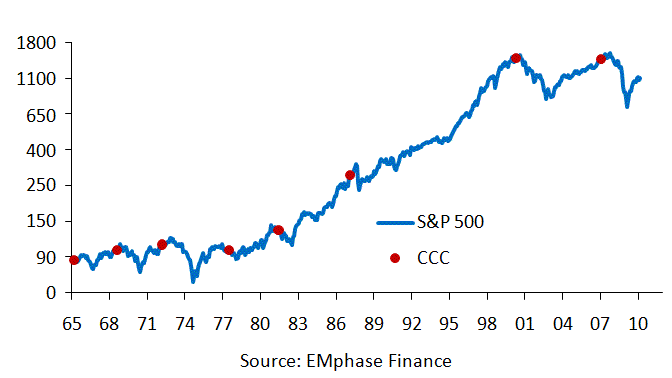
Take a look at the chart below. And no... We didn't cheat by manually pin pointing S&P 500 peaks on an Excel spreadsheet. These are the actual and concise results from rules explained earlier. We believe these two sets of rules do make sense and respect our K.I.S.S. (Keep It Simple & Sweet) philosophy.

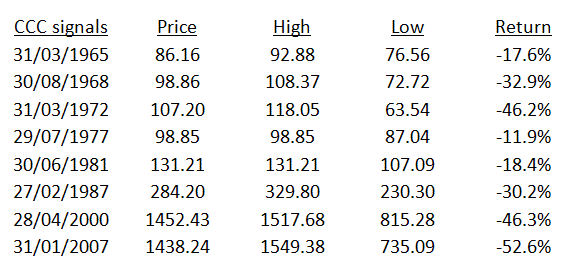
See below the summary of all CCC signals. First column is date of occurrence, second column is monthly closing price at signal, third column highest monthly closing seen following signal, fourth column is lowest monthly closing seen following signal and fourth column is the awful S&P 500 return seen:

The average decline following our CCC signal is -32.0%. Note the loss in 1977 is more than -11.9% and below -15.0% if we are taking daily data instead. Moreover, S&P 500 declined more than -15.0% in 1998 and we didn't get a CCC signal but it is not an issue and debatable considering equity peaked in 2000.
Conclusion
How to exploit a CCC signal? When it happens, we suggest to closely monitor S&P 500 price movements with various tools for an imminent reversal. For example, simple technical indicators or sentiment indicators may help on a short-term horizon identify the right moment to adopt a more bearish stance.
Our CCC signal is probably one of the best indicator of S&P 500 peaks available and is yet undefeated with no false signal. Based on this model only, there is no equity meltdown in sight. This corroborates our view the U.S. economy recovered from the latest recession and is now back in expansion mode.
About Us
Background
EMphase Finance is an independent investment advisor in the management of equity
portfolios for both private and institutional clients. More information: www.emfin.com
Contact
François Soto, Chief Investment Strategist of EMphase Finance, fsoto@emfin.com
300 Ave. Des Sommets, Suite #1213, Montreal, QC, Canada, H3E-2B7, 514.984.9155
Pricing
Annual subscription to one/first international or sectoral service = TBA
Annual subscription to 2nd & 3rd additional services = TBA
Annual subscription to 4th+ additional services = TBA
Consultancy service available upon request = TBA
Disclaimer
Accuracy of Information
This report is based on sources believed to be reliable or trustable and the information is provided without responsibility. However, EMphase Finance cannot guarantee its accuracy.
No Recommendation
This report is issued only for informational or educational purposes. This report doesn’t contain any solicitation from EMphase Finance to act as a securities broker or dealer in any jurisdiction.
No Responsibility
EMphase Finance will not be held responsible for any direct or indirect loss arising from any use of material included in this report and this to the full extent permitted by the law.
Copyright
This report is the property of EMphase Finance. Reproduction may be permitted only by written consent. The use of any content and charts for any purpose is strictly prohibited.
Sources
BB, BC, BEA, BLS, CB, CBO, CBOE, ECRI, FHFA, FRB, GOOG, GSCI, ISM, MBA, MC, NAHB, NBER, S&P.
By Francois Soto, President EMphase Finance www.emfin.com
© 2010 EMphase Finance. All rights reserved. EMphase Finance strives to become one of the most important website in North America concerning fundamental analysis using traditionnal quantitative and technical analysis based on the Elliott Wave Principle. The website will contain detailed analysises concerning specific companies, commodities and indexes along with educational content.
© 2005-2022 http://www.MarketOracle.co.uk - The Market Oracle is a FREE Daily Financial Markets Analysis & Forecasting online publication.


