New Stock Sector Leadership Ahead
Stock-Markets / Sector Analysis Apr 08, 2010 - 05:46 AM GMTBy: Francois_Soto
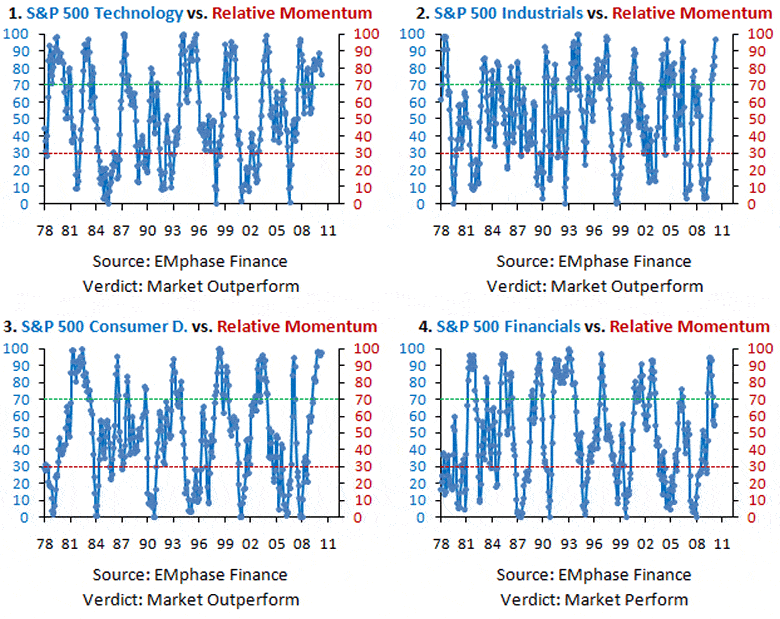
 We just added new tools to analyze sector allocation on our U.S. Economics Monthly research. As of March 2010, the four sectors with highest momentums are consumer discretionary, industrials, technology and financials but that last one is starting to lose some steam (1 to 4). Can we expect these market outperformers to keep being the winners of the next 12 months? What is history telling us?

Chris Puplava from FSO also wrote about sector allocation this week and he said:
"Current leading economic indicators (LEIs) appear to be topping and such an event should have broad implications for sector leadership going forward. Quite fortuitously, the defensive sectors that outperform when the LEIs are turning down are deeply oversold on a relative basis versus the S&P 500."
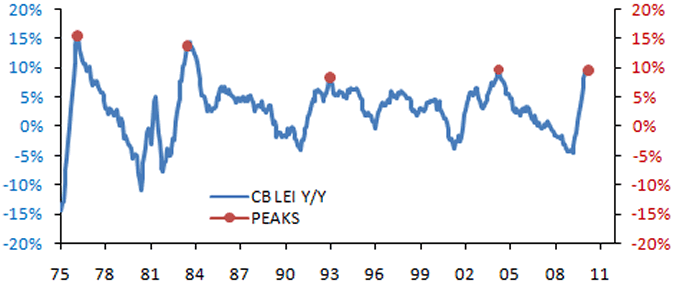
Is he right? To answer all these questions, we adopted a similar approach. We started looking at ECRI Weekly LEI Y/Y and CB LEI Y/Y peaks between 1975 and 2010. We noticed there is a difference of peaks between these indicators, they do not seem to coincide. We found out CB LEI Y/Y provides the best signals for sector allocation purposes so we decided to discard ECRI Weekly LEI Y/Y from this analysis.
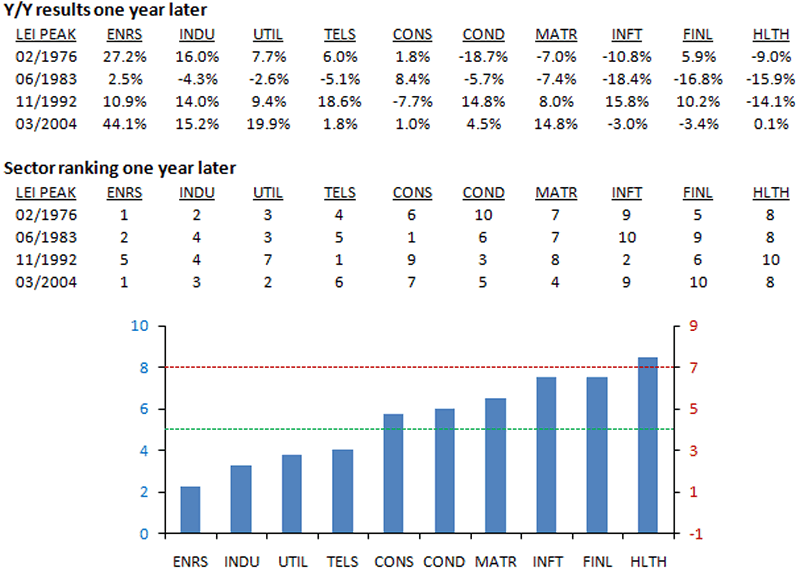
We charted below all peaks on CB LEI Y/Y and we calculated sector breakdown returns one year later.

Source: Emphase Finance

Source: EMphase Finance
Conclusion
Sectors that outperformed when bear market ended are expected to take a break as their reward to risk diminished. On another hand, sectors that underperformed during the economic recovery and the beginning of early stage expansion outperformed all the others following CB LEI Y/Y peaks. These sectors are energy, industrials, utilities and telecom. Sample is small but tested on nearly four decades.
About Us
Background
EMphase Finance is an independent investment advisor in the management of equity
portfolios for both private and institutional clients. More information: www.emfin.com
Contact
François Soto, Chief Investment Strategist of EMphase Finance, fsoto@emfin.com
300 Ave. Des Sommets, Suite #1213, Montreal, QC, Canada, H3E-2B7, 514.984.9155
Pricing
Annual subscription to one/first international or sectoral service = TBA
Annual subscription to 2nd & 3rd additional services = TBA
Annual subscription to 4th+ additional services = TBA
Consultancy service available upon request = TBA
Disclaimer
Accuracy of Information
This report is based on sources believed to be reliable or trustable and the information is provided without responsibility. However, EMphase Finance cannot guarantee its accuracy.
No Recommendation
This report is issued only for informational or educational purposes. This report doesn’t contain any solicitation from EMphase Finance to act as a securities broker or dealer in any jurisdiction.
No Responsibility
EMphase Finance will not be held responsible for any direct or indirect loss arising from any use of material included in this report and this to the full extent permitted by the law.
Copyright
This report is the property of EMphase Finance. Reproduction may be permitted only by written consent. The use of any content and charts for any purpose is strictly prohibited.
Sources
BB, BC, BEA, BLS, CB, CBO, CBOE, ECRI, FHFA, FRB, GOOG, GSCI, ISM, MBA, MC, NAHB, NBER, S&P.
By Francois Soto, President EMphase Finance www.emfin.com
© 2010 EMphase Finance. All rights reserved. EMphase Finance strives to become one of the most important website in North America concerning fundamental analysis using traditionnal quantitative and technical analysis based on the Elliott Wave Principle. The website will contain detailed analysises concerning specific companies, commodities and indexes along with educational content.
© 2005-2022 http://www.MarketOracle.co.uk - The Market Oracle is a FREE Daily Financial Markets Analysis & Forecasting online publication.


