


Consumer Balance Sheet and Consumer Spending in Perspective Economic Recovery Implications
Economics / US Economy Apr 08, 2010 - 05:58 AM GMTBy: Mike_Shedlock

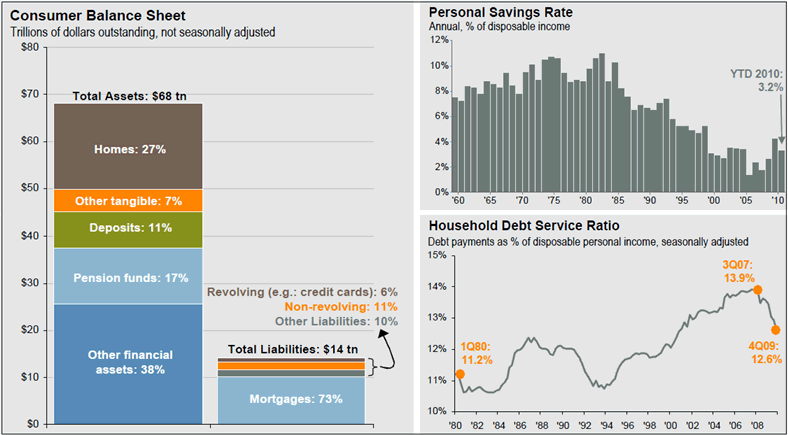
 Here is an interesting chart on Consumer Balance Sheet, Savings Rate, and Debt Service Ratio posted by Barry Ritholtz.
Ritholtz also notes Consumers Climb Out of Their Bunkers
From the “It-Aint-That-Bad” file comes the most recent reports of consumer spending.
- Luxury sales rose 22.7% (Mastercard SpendingPulse)
- Furniture sales rose 13.8% and appliance sales rose 6.9%
- Auto sales gained 24% from year ago levels (AutoTalk)
- March was the 7th consecutive month of increasing retail sales growth
- Cargo volume at major ports imports is trending towards an 8% increase in April
- Commerce Department’s personal consumption expenditures was $34.7 billion in February, an increase of 0.3% over January — the fifth monthly gain in a row.
- Gasoline demand continues to rise — +1.2% — before the summer driving season.
Ritholtz comments "It will be some time before we return to the peak levels of 2006-07, when Houses were used more as equity structures than shelter. But that does not mean we won’t see marked improvements over the coming quarters."
Fair enough. Here is an equally true and arguably more realistic way of saying the same thing: The anemic bounce to date "does not mean we will see marked improvements over the coming quarters."
State Sales Tax Revenues
State tax collections are a far better measure of spending than same store sales. Please consider Retail Sales Rise: Where? Let's Take a Look; Expect Nothing Less Than Panic
That report is from February 28, 2010, arguably a bit out of date. Nonetheless, state tax collections are horrid.
Moreover, same store sales are invalid because of store closings. Finally, improvements over horrendous numbers from a year ago are hardly unexpected.
Finally, please note that it took cash for clunkers, $8,000 tax credits, a $trillion in various Fed swap-o-rama programs, and the Fed monetizing a $trillion in mortgages to achieve this bounce in GDP.
What's next?
Consumer Balance Sheet Chart Brutally Misleading
In isolation, the balance sheet chart at the top of this post seems to indicate the problem with consumer debt is overstated.
For a different perspective, please consider Wealth, Income, and Power by Professor G. William Domhoff at the University of California at Santa Cruz.
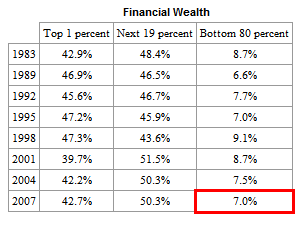
In the United States, wealth is highly concentrated in a relatively few hands. As of 2007, the top 1% of households (the upper class) owned 34.6% of all privately held wealth, and the next 19% (the managerial, professional, and small business stratum) had 50.5%, which means that just 20% of the people owned a remarkable 85%, leaving only 15% of the wealth for the bottom 80% (wage and salary workers). In terms of financial wealth (total net worth minus the value of one's home), the top 1% of households had an even greater share: 42.7%. Table 1 and Figure 1 present further details drawn from the careful work of economist Edward N. Wolff at New York University (2009).
Financial Wealth Distribution
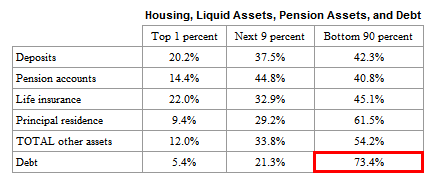
Housing, Liquid Assets Distribution
Income and Wealth by Race
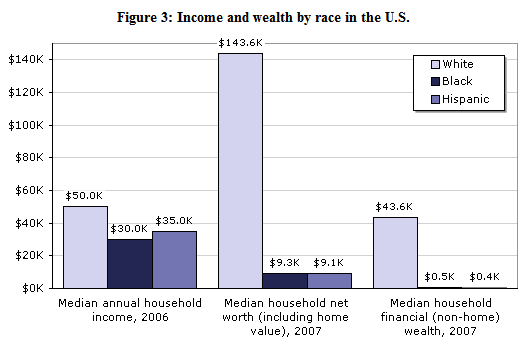
Besides illustrating the significance of home ownership as a measure of wealth, the graph also shows that Black and Latino households are faring significantly worse overall, whether we are talking about income or net worth. In 2007, the average white household had 15 times as much total wealth as the average African-American or Latino household. If we exclude home equity from the calculations and consider only financial wealth, the ratios are in the neighborhood of 100:1.
Extrapolating from these figures, we see that 70% of white families' wealth is in the form of their principal residence; for Blacks and Hispanics, the figures are 95% and 96%, respectively.
Table 5a: Concentration of stock ownership in the United States, 2001-2007
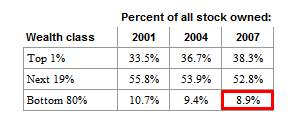
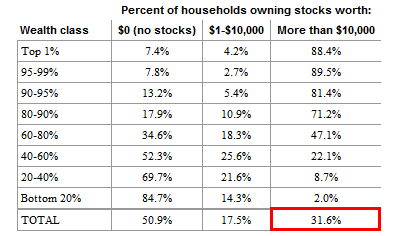
Table 5b: Amount of stock owned by various wealth classes in the U.S., 2007
Just as wealth can lead to power, so too can power lead to wealth. Those who control a government can use their position to feather their own nests, whether that means a favorable land deal for relatives at the local level or a huge federal government contract for a new corporation run by friends who will hire you when you leave government. If we take a larger historical sweep and look cross-nationally, we are well aware that the leaders of conquering armies often grab enormous wealth, and that some religious leaders use their positions to acquire wealth.
If the top 20% have 84% of the wealth (and recall that 10% have 85% to 90% of the stocks, bonds, trust funds, and business equity), that means that the United States is a power pyramid. It's tough for the bottom 80% -- maybe even the bottom 90% -- to get organized and exercise much power.
Summary of Key Points
- The Bottom 80% have a mere 7% of financial wealth.
- The Bottom 80% have a mere 8.9% of stock ownership
- Only 31.6% of the population has more than $10,000 in stocks.
- 70% of white families' wealth is in the form of their principal residence; for Blacks and Hispanics, the figures are 95% and 96%, respectively.
That was an extremely well written article by Domhoff. Inquiring minds will want to give it a closer look.
The facts do not point to a robust recovery in spending. Indeed they do not point to any recovery in spending beyond the massive government intervention that we have seen to date.
This is not 2006. Homeowners cannot tap their houses for home equity spending. Moreover, some of the data for that report was from 2007. There have been millions more bankruptcies since then.
Millions of households are underwater in their mortgages. Banks are stuck with massive numbers of REOs via foreclosure.
The unemployment rate is hugely understated at 9.7%. Alternative measures show unemployment at 16.9% and even that number does not count Realtors and self employed persons on commission who have not had reportable income for months.
There is no driver for jobs except government stimulus.
A Record 39 Million Receive Food Stamps, the 14th Consecutive Monthly Increase.
Consumer credit does not give any hints of sustainable increases in spending or lending. Please consider Consumer Credit Drops $11.5 Billion, 5.6% annualized, 12th drop in 13 Months. The Increase In January was a Mirage related to Student Loans.
Also note that millions of boomers are headed into retirement severely underfunded. That fact alone shows how wrong it is to expect a huge bounce in consumer spending.
It is important to factor in the effects of increased cutbacks by cities and states in response to numerous fiscal crises. For example ....
- Los Angeles: L.A. to Shut Down City Departments in Budget Crisis; IBEW Local 18 Head: "How Taxpayers Feel Is Not Relevant"
- Detroit: Detroit Bankruptcy Looms with Deficit of $446 Million in Budget of $1.6 Billion
- Los Angeles: LA Deputy Chief of Staff Says "Unions Have Priced Themselves Out Of A Job"
- New Jersey: Governor Christie Calls Unions "Crass Bullies of State Street"; Says Unions Have a Choice "Givebacks or Layoffs"
- Missouri, Indiana, Washington, Kansas: Missouri Budget Overstates Revenues By Up To $1 billion; Indiana Revenue Falls Short; Budget Battles In Washington; Budget Gaps In Kansas
- Illinois: Rep. Suzie Bassi: "Illinois in Utter Crisis, Next to Bankruptcy, $13bn Hole in a $28bn Budget"; Ambrose Evans Pritchard Inflicted with FIV
That is just a small sampling of problems facing cities and states. Layoffs are coming. Those layoffs need to be factored into to consumer spending. So does the rise in mortgage rates now that the Fed has stopped monetizing treasuries.
Finally, consumer and bank attitudes play a key role.Consumer attitudes towards spending and consumption have changed for good. So have bank attitudes towards lending. Bernanke can cajole all he wants, but $1 trillion in excess reserves tells part of the story. Undercapitalization of banks tells much of the rest.
All thing considered, it is a mistake to extrapolate forward a continued recovery in spending from the depressed levels of 2009. It is far more likely, this is about all we get.
By Mike "Mish" Shedlock
http://globaleconomicanalysis.blogspot.comClick Here To Scroll Thru My Recent Post List
Mike Shedlock / Mish is a registered investment advisor representative for SitkaPacific Capital Management . Sitka Pacific is an asset management firm whose goal is strong performance and low volatility, regardless of market direction.
Visit Sitka Pacific's Account Management Page to learn more about wealth management and capital preservation strategies of Sitka Pacific.
I do weekly podcasts every Thursday on HoweStreet and a brief 7 minute segment on Saturday on CKNW AM 980 in Vancouver.
When not writing about stocks or the economy I spends a great deal of time on photography and in the garden. I have over 80 magazine and book cover credits. Some of my Wisconsin and gardening images can be seen at MichaelShedlock.com .
© 2010 Mike Shedlock, All Rights Reserved.
© 2005-2022 http://www.MarketOracle.co.uk - The Market Oracle is a FREE Daily Financial Markets Analysis & Forecasting online publication.