Foreign Stock Markets Outshine U.S. on Increasing Investor Risk Appetite
Stock-Markets / Stock Markets 2010 Apr 12, 2010 - 05:37 AM GMTBy: Money_Morning
 Jon D. Markman writes: U.S. stocks carved out one of their patented half-percent advances last week -- a little sloppy, to be sure, yet not bad at all considering their very overbought condition.
The stars of the global capital show this month, though, have been markets in China and Europe, as they shook off their multi-month torpor to score big wins. With a scorching 6% advance in the past two weeks, ishares FTSE Xinhua China 25 Index (NYSE: FXI) nosed up to log a +5.5% gain for the year after being negative for three months. And the ishares S&P Europe 350 Index (NYSE: IEV) rose 1%, putting it at flat for the year after malingering below zero.
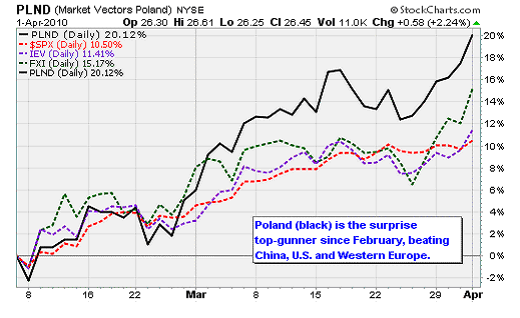
One of the strongest performances over on the Continent this year has belonged to Market Vectors Trust ETF Poland (NYSE: PLND), which tragically lost its president, his wife, and top military brass in a plane crash in Russia over the weekend. Poland has been the lead economy in a group that's come to be called "emerging Europe" and trades in the single SPDR S&P Emerging Europe ETF (NYSE: GUR). Warsaw stocks rose 6.5% this week, and are now up 9.5% for the year amid a resurgence of attention to its unique position straddling east and west. Poland is the fastest growing economy in eastern Europe, and blessed with largely unleveraged consumers who are back home after years of working elsewhere. PLND owns mostly mid-cap banks and basic materials producers.
Also feeling the love were British stocks as pound sterling recovered. The London exchange ishares MSCI United Kingdom Index (NYSE: EWU) has risen 2.9% this month, about double the Dow Jones Industrials. The rest of the headliners over there are ishares MSCI Netherlands Investable (NYSE: EWN), up 2.9%; ishares MSCI Austria Investables Mkt (NYSE: EWO), up 4.9%; and Market Vectors ETF Trust Russia (NYSE: RSX), up 4.5% on a resurgence in energy prices.
And finally I need to point out the big month at iShares MSCI Turkey Index Fund (NYSE: TUR), up 8.3%, and the high-beta frontier play, Market Vectors Egypt Index ETF (NYSE: EGPT), +7%.
The reason I am mentioning all of these is to show that the appetite for risk-taking among investors has intensified in the past few weeks. Coming out of the February low earlier this year, the big moves were primarily in the safest U.S. stocks as fears over the Greek debt crisis paralyzed European shares and worries over Chinese credit tightening did the same in Asia, Australia and Brazil.
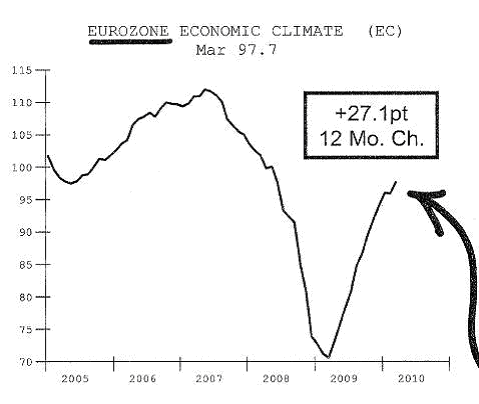
In early- to mid-March the move broadened out to smaller and friskier U.S. stocks and the European and Chinese exchanges remained stuck in neutral. But now the Europeans and Middle East have done what we always expected them to do, in a time-honored tradition: brush their family problems under the rug. And new data showed Chinese banks have done what they always do too: Kept on lending.
So while everyone, expected Europe to slowpoke it through the rest of the year, the Continent instead has been on a tear; you can see that the climate has ticked up continuously higher since the lows of 2009 in the chart above.
Thus what we have now in world markets is a huge separation of returns across oceans for the first time in a year. U.S. markets are very overbought ahead of companies' earnings season and due for a pause, while European, Latin American and Chinese markets are just barely rising off the floor. That makes the latter a better buy now.
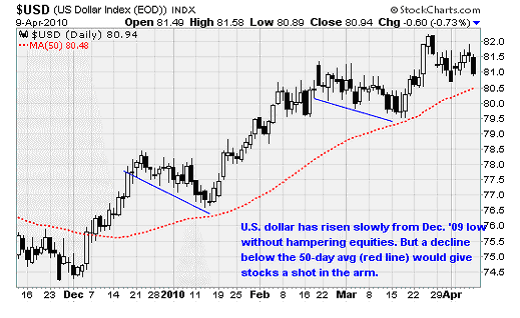
All of this is happening against the backdrop of a flat-lining dollar, which is doubly conducive to strength in overseas markets. The buck may just be tracing out another in a series of bull "flags," which is a continuation pattern as shown in the first two blue trend lines in the chart above. If the dollar continues to slip against a basket of currencies (mostly euro and pound), and pierces its 50-day average for the first time this year, it would be especially bullish for global equities.
Note that the first up arrow in the chart occurred on January 19, which was the start of the January-February correction in U.S. stocks; a similar turnaround in the dollar would likely have same effect if it occurs soon, or even later this Spring.
Public sentiment on European, Chinese and Brazilian equities has been quite poor despite the recent jump, so this initial burst of strength in April is unlikely to be the last. It takes an enormous amount of firepower and risk-taking ardor for investors to put their money to work in untested, perilous markets like Poland and those early risk-takers are likely to follow up successful initial attempts with more of the same.
This a good thing, and something we have already been taking advantage of. Our position in Market Vectors Indonesia Index (NYSE: IDX) has been aimed at capturing the same phenomenon, and the only difference is that it started a lot earlier, and with more business justification. The nice thing about looking overseas now is that in Europe and Brazil, in particular, there are a lot of great companies whose shares are essentially on sale.
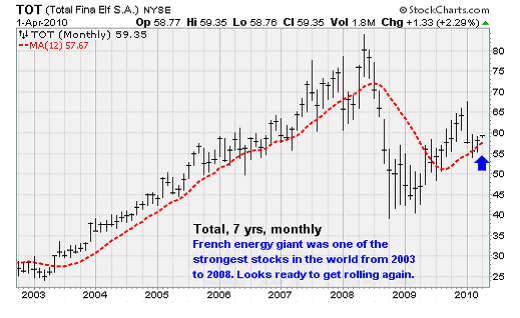
Consider companies like Total S.A. (NYSE ADR: TOT) for instance. IF you want instant access to European industry, this is it. It explores for oil and gas, retails both, makes chemicals, and has new subsidiaries in coal and solar. The chemical division produces and trades lubricants, jet fuel, petrochemical feedstock for plastics, and the like. TOT has interests in 24 refineries from Europe and the United States to the Caribbean and China, and nearly 16,300 retail gas stations.
It sports a 5.2% dividend, and has been one of the most prolific explorers in the hottest area in the world for energy, which is Africa, with major projects in Nigeria, Angola, Algeria and Yemen, along with Vietnam. Like all the majors, it needs new production just to stay even as its existing fields in the North Sea decline. Total became the industry goliath that it is today when it merged with Petrofina of Belgium in 1999 and then fellow French firm Elf Aquitaine in 2000.
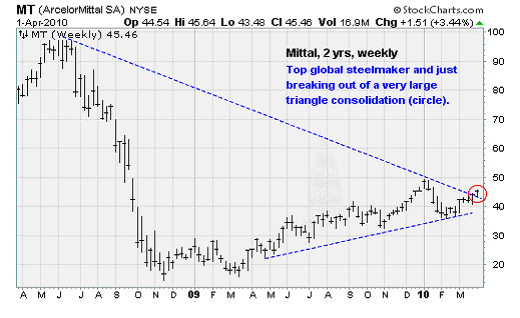
Another European company whose shares have caught fire recently is ArcelorMittal (NYSE ADR: MT), which already accounts for 9% of the capitalization of our recommended Market Vectors Steel (NYSE: SLX) fund. MT, which was originally built in India and then moved its headquarters to Luxembourg after buying Arcelor a few years ago, is right in the center of all the industrial growth in the world due to its position of being a top supplier of steel to manufacturers of cars, appliances, oil platforms, buildings, civic infrastructure. Yep, just about everything requires steel -- so you can't have a global economic recovery without companies like Mittal seeing a lot of demand.
Profit margins are razor thin in commodity businesses like this, so management focus on cost cutting and achieving economy of scale are key. Shares are very reasonably priced after being shellacked during the financial crisis, at only 1x sales and 9x earnings, so there is plenty of headroom in the valuation. MT is a go-to stock for portfolio managers to gain exposure to Europe, industrialism and steel itself, so expect it to roll a lot higher over the next five years as the recovery gains traction and becomes an expansion.
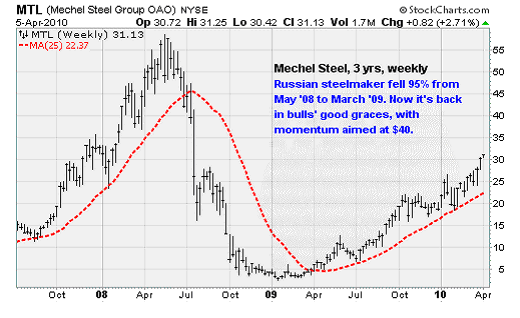
Several other steel-makers worldwide are kicking to new highs, including Reliance Steel & Aluminum (NYSE: RS), U.S. Steel Corp. (NYSE: X) Companhia Siderurgica Nacional (NYSE ADR: SID) of Brazil, and Mechel Steel Group OAO (NYSE ADR: MTL) of Russia, shown above.
.Hard to believe they were all down 90%-plus a year ago. In the next year, don't be surprised to see brand-new all-time highs, as companies that can raise prices will be considered ideal hedges against inflation. Much better than conventional hedges like gold, since steel is actually useful rather than just decorative and a supposed store of value. Be sure to participate by buying SLX, at least, on 2% to 4% pullbacks.
Money growth weakens
If there is one worrisome macroeconomic event on the horizon it's the slowdown in money growth in developed markets. It's fallen sharply in the past six months in the United States, Western Europe, Australia, Mexico and even in eastern Europe countries like the Czech Republic and Hungary. ISI Group figures the decline in money growth has developed as a result of banks' reluctance to lend, and could be the early omens of a slowdown in GDP growth in 2011 or 2012.
Yet even as money growth has slowed, central banks have taken up the task of buying stuff. You may have heard a hundred times by now that the U.S. Federal Reserve has ended its program of buying mortgages. Yet mysteriously the Fed's balance sheet actually grew again last week, hitting a new high of $2.3 trillion, vs. a bit less than $1 trillion a year and a half ago.
The last time that deleveraging swept the U.S. economy, money growth here dove from +7% a year in 1990 to zero in 1995, and there were wails of complaints the whole time. Yet the expansion then carried on through 2000 as the stock market more than tripled.
How can this happen? It occurs because the velocity of money often means more than the growth of money. That is, it matters more how fast people are spreading money around than how much money there is.
ISI observes that the ratio of U.S. GDP to money, a proxy for the velocity of money, jumped to 2.1 in 2000 from 1.8 in 1990, which more than offset the plunge in money growth. The same velocity now is 1.7, so it has a lot of room to move up -- again offsetting the decline in money growth
The Battle for 1,200
Last week we talked the looming battle for the 1,200 level in the S&P 500. It looks to me as if the payrolls number that was reported early in the month has supplied all the ammo that bulls need to make a legitimate run at it. Step back a few paces and you'll see that it showed the economy is improving in a way that is a bit slower than the fastest recoveries but stronger than the weakest ones.
That suggests that consumers are strengthening enough to provide companies with the earnings that they need to make a decent showing of first-quarter 2010 earnings reports but not enough to over-stimulate in a way that will scare the Fed with whispers of inflation.
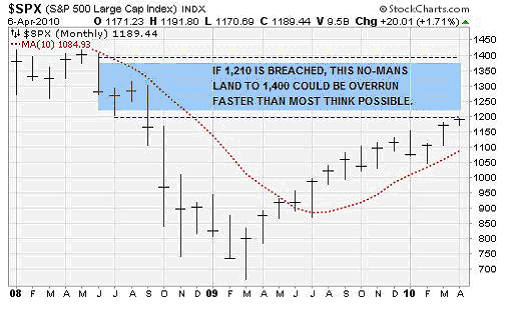
Since the 1,200 level was where the Lehman Brothers bankruptcy caused the bottom to fall out of the market in September, 2008, a successful bull attack at that level will cause all remaining "panic trades" by bears to be reversed. That means not just covering shorts that have been in place for 18 months but also the sale of the super-safe Treasury bonds to which investors flocked then. Sales of the T bonds has pushed their yields up in a way that has worried investors, but this phenomenon should really just be seen in the context of this panic reversal trade rather than as a major shunning of U.S. debt.
This level of 1,180 to 1,210 will likely bring a lot of turbulence, and perhaps we'll finally get the long-expected pause or setback that would take some air out of overbought stocks. But after that energy is spent, the much larger -- and usually smarter -- world of credit is saying that the establishment of new longs by ex-bears, and widespread short-covering, could make for an explosive move higher toward 1,300 and beyond in the summer.
Credit analyst Brian Reynolds reminds us that credit is already trading at levels that are the above the 1,400 level of the S&P 500, and it has led equities at every turn in the past few years. So risk may surprisingly be more to the upside than to the downside.
Week in review
Monday: The ISM Service Index beat expectations after its new-orders component grew at its fastest month-over-month rate in five years. Activity, which is akin to an output index for the non-manufacturing sector, climbed to its best reading since 2006. Separately, pending home sales increased 8.2% in February -- pointing to ongoing stabilization in the housing market.
Tuesday: The Federal Reserve released the minutes of its March 16 meeting. In it, the Fed policymakers continued to worry about the pace of the recovery. By all indications, it's likely that ultra-low interest rates are here to stay for longer than most realize.
Wednesday: Federal Reserve chairman Ben Bernanke spoke in Dallas. Although nothing major was said, Bernanke did forcefully discuss the need to bring down the government's long-term fiscal deficit problem.
Thursday: Retailers were stars of the show on the news side of the tape after the biggest U.S. chains reported a stunning 9.1% year-over-year same-store sales increase in March, a number that blew away already high expectations. Receipts showed consumer demand more buoyant than employment statistics have lead most people to believe. Of the 28 retailers tracked by Reuters, 90% topped estimates.
Initial weekly jobless claims came in slightly higher than expected at 460k -- ahead of the consensus estimate of 436k. Seasonal distortions due to the Easter holiday were blamed for the backwards slide. The four-week moving average continues to stall near 450k.
Friday: Wholesale inventories increased 0.6% in February -- a solid sign that wholesalers are rebuilding their stock and are feeling more optimistic about the future.
The week ahead
Monday: A batch of short-term Treasury auctions and the release of the U.S Treasury's monthly budget.
Tuesday: A report on the U.S. trade balance. The trade deficit likely grew in February as oil prices rose and a rebound in consumer spending drove imports.
Wednesday: An update on inflation from the March data for the Consumer Price Index. Inflation is expected to remain well contained as housing costs continue to weigh on the overall index. This gives the Federal Reserve plenty of room to keep interest rates low.
Thursday: We'll get a look at the ongoing rebound in the manufacturing sector from the March Industrial Production report. Watch for another increase in the capacity utilization rate, from 72.7% in February to 73.4% in March.
Friday: An update on consumer sentiment and a report on housing starts in March will be released.
Source : http://moneymorning.com/2010/04/12/foreign-investing/
Money Morning/The Money Map Report
©2010 Monument Street Publishing. All Rights Reserved. Protected by copyright laws of the United States and international treaties. Any reproduction, copying, or redistribution (electronic or otherwise, including on the world wide web), of content from this website, in whole or in part, is strictly prohibited without the express written permission of Monument Street Publishing. 105 West Monument Street, Baltimore MD 21201, Email: customerservice@moneymorning.com
Disclaimer: Nothing published by Money Morning should be considered personalized investment advice. Although our employees may answer your general customer service questions, they are not licensed under securities laws to address your particular investment situation. No communication by our employees to you should be deemed as personalized investent advice. We expressly forbid our writers from having a financial interest in any security recommended to our readers. All of our employees and agents must wait 24 hours after on-line publication, or 72 hours after the mailing of printed-only publication prior to following an initial recommendation. Any investments recommended by Money Morning should be made only after consulting with your investment advisor and only after reviewing the prospectus or financial statements of the company.
Money Morning Archive |
© 2005-2022 http://www.MarketOracle.co.uk - The Market Oracle is a FREE Daily Financial Markets Analysis & Forecasting online publication.


