


Weekly Gold and Silver Technical Analysis Report - 18th August 2007 - Technically Precious with Merv
Commodities / Gold & Silver Aug 18, 2007 - 07:27 PM GMTBy: Merv_Burak

Scary? Maybe, but we've been there before. $21 (or 3%) drop in gold price is not so unusual. What next? Let's take a quick look at where we've been and see if we can guess what to expect ahead.
Who's Panicking?
It's just my unsophisticated guess as to who has been panicking these past few days but it looks like the panicky people are in two classes. First are the commentators and media personalities. They doth not knoweth of what they speaketh off most of the time. The second are the industry professionals, you know the kind, those that continually advise you to look at the long term and not at the short term fluctuations. They are often the first to panic during short term troubles.
So, what should one do now? I'm not in a position to know everyone's investment or speculative strategies but could offer a suggestion for the road ahead. I have been cautioning for some time now that the momentum (or strength) behind the price action in gold bullion or gold stocks has been weakening and that this was not good. This past week might just have been the culmination of such weakness but I suspect that the weakness is still not totally over. However, it may now be time to start watching for the underlying momentum in the price action to begin to show strengthening in anticipation of the next up turn in the markets. There are times the market turns on a dime, before the momentum has time to build up steam.
At such times one understands the turn only after the fact. Most of the time, however, the price momentum indicator (and there are a variety of them) will show strengthening BEFORE the price has hit its final low. This is commonly referred to as the positive divergence effect. Should we get this momentum effect it might get you in on the next market phase very close to the bottom, and for those who are, or have been, inclined to play the short side, it will give you that signal to cover before you lose your profits (or your shirt).
GOLD
The long term P&F chart has not moved since the last time it was shown in the 03 Aug 2007 commentary. Despite the sharp decline on Thursday the price did not even get to the point of reversing the direction of the plot, least of all changing the trend. How long this will last is anyone's guess but for now nothing has changed from the long term P&F stand point. Still in a BULL phase with projections to $780 and then to $915. However, a move to $630 would cause the trend to change to the BEAR with a projection to the $510 level.
Looking at the usual indicators, as might be expected gold closed below its long term moving average line but the line is still in a very slight upward slope and has not yet turned to the down side. Price momentum is bouncing off the 51% level, its lowest level since the Oct 2006 bottom, for a still positive reading with noted weakness versus price action. The volume action does not suggest a great exodus during the slide. Volume action was heavier during the late July drop. The volume indicator, however, is still below its long term trigger line and not improving yet.
Putting all of this together there is still no reason to change the long term rating from the BULLISH rating of the past few weeks. The long term will, of course, be the last time period to change its rating should the weakness continue.
INTERMEDIATE TERM
The intermediate term P&F chart gave us a BEAR signal this past week with a projection to $595. The direction reversed back to the up side but has not changed the primary bear trend. The move stopped just above a well established support level from the June low. We'll just have to wait and see if the new trend will break below the support and head towards its projection or if the support will hold.
Gold is below its intermediate term moving average line and the line had turned downward with the Thursday action. Over the past year one might say that gold has been in an intermediate term oscillating process turning up and down but not really getting anywhere. We're still not going anywhere despite the new bear trend. Momentum is in its negative zone but over the past many months it has been more in a lateral trend than positive or negative. In this respect it is mimicking the lateral oscillations of the gold price.
With the P&F , moving average and momentum all going negative I have no choice than to be BEARISH on the intermediate term.
SHORT TERM
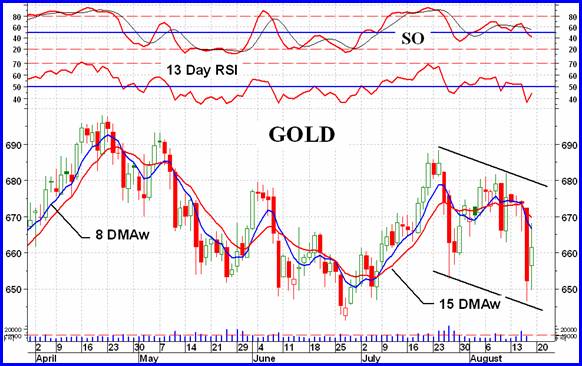
With activity such as this past week one can only assume the short term direction is to the down side. Friday's somewhat recovery was not too convincing. Both the moving average and momentum are in their negative phase so I will continue with the trend in motion and stay bearish until more upside action says otherwise.
IMMEDIATE TERM
One might assume that Friday was just a knee jerk reaction to the plunge on Thursday. This is a normal reaction but often does not last long. There has been too much damage for a steady upside reaction. Monday and possibly Tuesday are seen as most likely further downside days but not necessarily in the mold of Thursday.
NORTH AMERICAN GOLD INDICES
Round and round we go and come up with the same Index every 5 weeks. Today we come up once more with the Dow Jones Precious Metals Index.
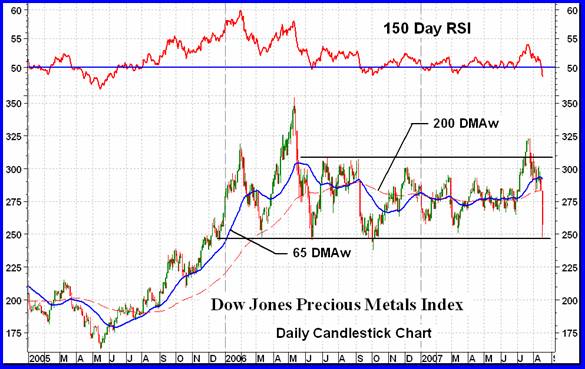
When last we looked in on the DJPMI it was just about to break through that year long resistance level. It subsequently broke through but the good news did not last long and it has been on a slide ever since. This week's activity brought the Index down to the year and a half support level and closed the week just above the support line. While momentum had moved with the price into new year long upper levels it has now moved even faster into new low levels. While the Index is still above support the momentum has made a lower low, lower than at any time since its May 2005 low. This does not bode well for where the Index is expected to go. Price strength seems to be on the down side so Friday bounce or not, still further lower levels are anticipated.
MERV'S PRECIOUS METALS INDICES
Bad but not the worst we've seen. The plunge from the May 2006 high was a lot worse and the one a few months later in Sept of 2006 was also worse. So, what can we expect? From these earlier plunges there is no firm criteria as to what comes next. The most likely scenario is some kind of rally in the not too distant future, but one can say that anytime. Major support lies just about 4% below the Friday Composite Index value.
MERV'S GOLD & SILVER 160 INDEX
I thought I was going to have some relaxation time but the market is just not cooperating. Last week I suggested that there was still at least another 8% drop in this Index to come. Boy, how fast it came. The decline of 13.2% on the week was just about par for the Merv's Indices while the North American major Indices had slightly lesser declines, more in the neighborhood of 11%. As for the universe, it was a slaughter. Only 5 stocks were able to show a gain (that's 3% of the universe) while a full 152 declined (that's 95% of the universe). The vast majority of stocks were double digit losers with five of the losers making it into my plus/minus 30% weekly category. Two of those were over the 40% mark (actually closer to 50%). These two stocks would require a 100% gain just to break even. The summation of individual ratings are now all in the BEAR 90% plus level (well, long term is at 89% but close enough). It's been a bad week for the stocks so let's just forget this week and hope for the best to come.
MERV'S QUAL-GOLD INDEX : MERV'S SPEC-GOLD INDEX : MERV'S GAMB-GOLD INDEX
The Qual-Gold declined 12.1%, the Spec-Gold declined 11.1% and the Gamb-Gold declined 12.5%. Now tell me, where is this great advantage in buying “quality” stocks supposedly for their lesser risk? This just continues to support my earlier work that showed in a major decline or bear market the “quality” decline just as much, % wise, as the cats and dogs of the industry. Of course there are individual stocks that decline far more than the average but this is true for both categories.
After this week the Gamb-Gold Index remains the only Index that is still showing a gain for the year. All other Indices, Merv's and the majors, are in the negative territory for the year to date. I suspect that there is more downside to come and the Gamb-Gold Index will take the brunt of the declines, as it has the greatest gains to be worked out.
All indicators are now negative so I wouldn't go into details this week. BEAR for all three Indices for all three time periods.
SILVER
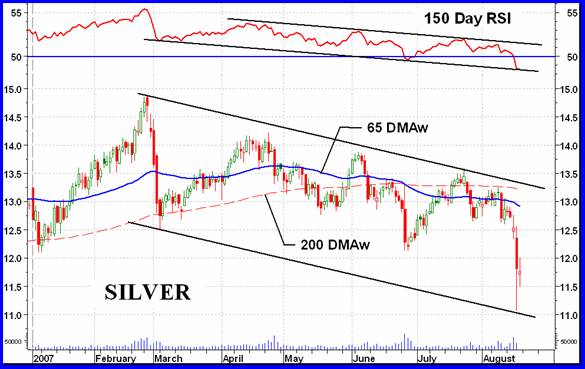
Silver continues to perform worse than gold with an 8.7% decline on the week versus gold's 2.1% decline. The trend has been steady for most of this year. This past week's action hit the lower channel trend line and one might expect some upside activity from here, maybe even one like the rally from the low in March. Rally or not, we are in a bear market for silver.
MERV'S QUAL-SILVER INDEX : MERV'S SPEC-SILVER INDEX
With silver taking a bigger hit than gold one could have expected the stocks to take a bigger hit also. That's what we got with the Qual lower by 13.2% and the Spec lower by a full 16.6%. All 25 Spec-Silver stocks declined with only 4 that were not double digit declines. It goes without saying that both Indices are in the bear territory for all time periods.
That's it for this week. Let's hope next week is better.
Merv's Precious Metals Indices Table
By Merv Burak, CMT
Hudson Aero/Systems Inc.
Technical Information Group
for Merv's Precious Metals Central
Web: www.themarkettraders.com
e-mail: merv@themarkettraders.com
During the day Merv practices his engineering profession as a Consulting Aerospace Engineer. Once the sun goes down and night descends upon the earth Merv dons his other hat as a Chartered Market Technician ( CMT ) and tries to decipher what's going on in the securities markets. As an underground surveyor in the gold mines of Canada 's Northwest Territories in his youth, Merv has a soft spot for the gold industry and has developed several Gold Indices reflecting different aspects of the industry. As a basically lazy individual Merv's driving focus is to KEEP IT SIMPLE .
To find out more about Merv's various Gold Indices and component stocks, please visit www.themarkettraders.com and click on Merv's Precious Metals Central . There you will find samples of the Indices and their component stocks plus other publications of interest to gold investors. While at the themarkettraders.com web site please take the time to check out the Energy Central site and the various Merv's Energy Tables for the most comprehensive survey of energy stocks on the internet. Before you invest, Always check your market timing with a Qualified Professional Market Technician
Merv Burak Archive |
© 2005-2022 http://www.MarketOracle.co.uk - The Market Oracle is a FREE Daily Financial Markets Analysis & Forecasting online publication.