


Stock Market "Dumb Money" Indicator Remains Extremely Bullish
Stock-Markets / Stock Markets 2010 Apr 19, 2010 - 04:32 AM GMTBy: Guy_Lerner

 Yes, it is the same story as the "Dumb Money" indicator remains extremely bullish. And yes, it is the same story as the market has once again enticed increasing number of investors that the "all clear" has been sounded. And yes, it will likely end in the same story as the market will once again serve up the maximum amount of pain for the majority of investors.
While the significance of Friday's high volume reversal has yet to be determined, the set up has the making of a market top - the majority of investors are poorly positioned and the precipitating event (i.e., the government's charges against Goldman Sachs) was not foreseen. For now, Friday's price action is just one day and one day does not make a trend. If anything, Friday's down day breathed some life into the bear case. The market is priced for perfection, and shocks aren't so well tolerated. From my perspective, this looks like the same old story of fear and greed.
And now this from the Department of Broken Records....
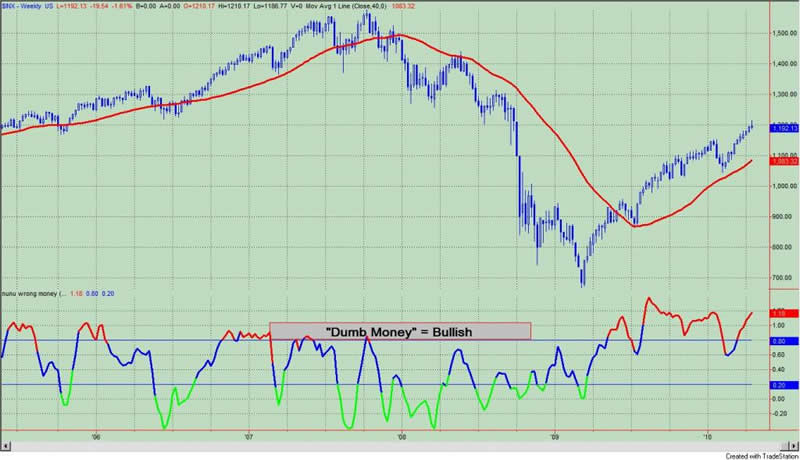
The "Dumb Money" indicator looks for extremes in the data from 4 different groups of investors who historically have been wrong on the market: 1) Investor Intelligence; 2)Market Vane; 3) American Association of Individual Investors; and 4) the put call ratio. The "Dumb Money" indicator is bullish to an extreme degree, and this implies that a price move is either nearing its end or the ascent of prices is surely to show.
This is our expectation 85% of the time. As discussed last week, not only is the current value extreme it is also less than prior extremes suggesting decreasing bullishness despite higher equity prices. This remains a noteworthy, yet unconfirmed, negative divergence.
Figure 1. "Dumb Money" Indicator/ weekly
The "Smart Money" indicator is shown in figure 2. The "smart money indicator is a composite of the following data: 1) public to specialist short ratio; 2) specialist short to total short ratio; 3) SP100 option traders. The Smart Money indicator is neutral/ bearish.
Figure 2. "Smart Money" Indicator/ weekly
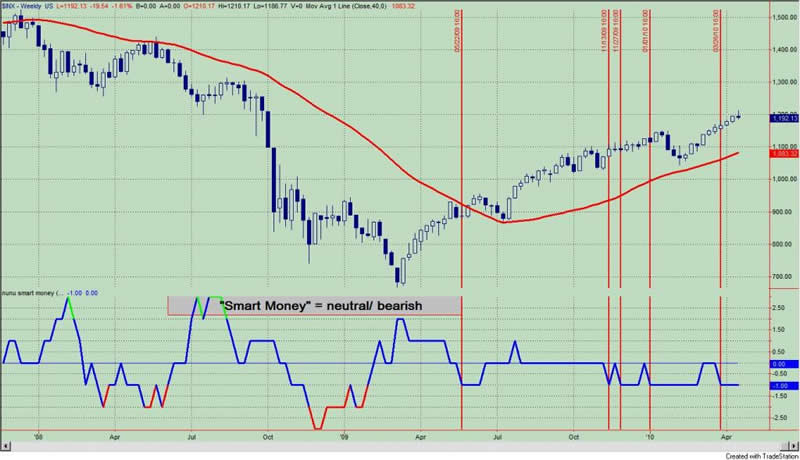
Figure 3 is a weekly chart of the S&P500 with the InsiderScore "entire market" value in the lower panel. From the InsiderScore weekly report we get the following: transactional volume decrease as the quarter closed but insiders continue to sell with conviction and buy sporadically.
Figure 3. InsiderScore Entire Market/ weekly
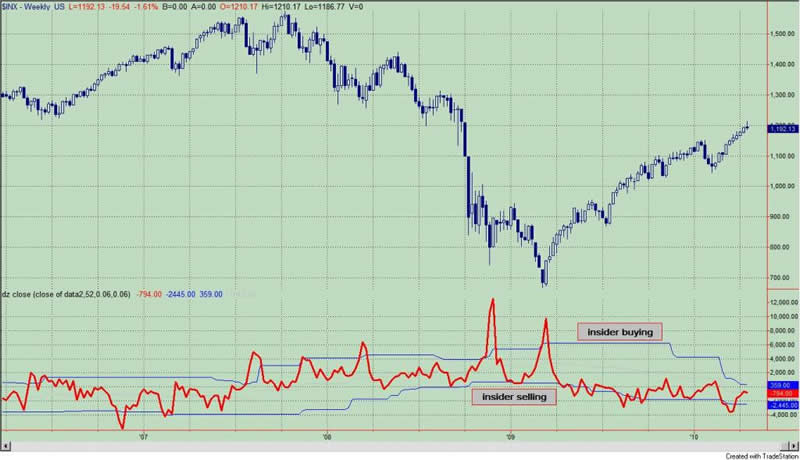
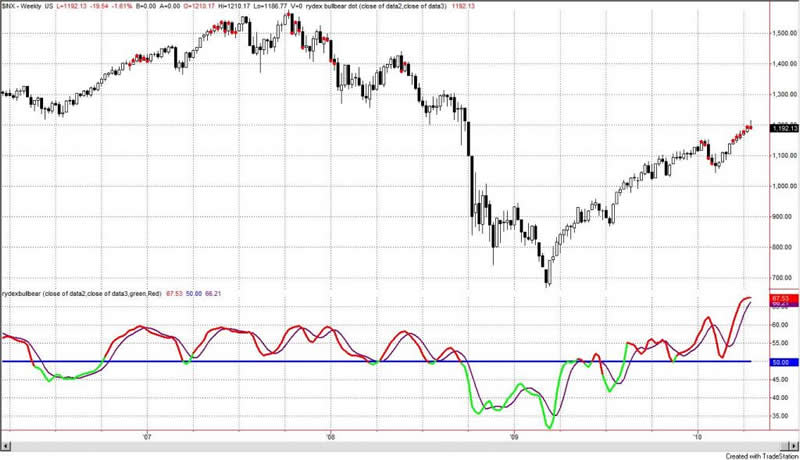
Figure 4 is a weekly chart of the S&P500. The indicator in the lower panel measures all the assets in the Rydex bullish oriented equity funds divided by the sum of assets in the bullish oriented equity funds plus the assets in the bearish oriented equity funds. When the indicator is green, the value is low and there is fear in the market; this is where market bottoms are forged. When the indicator is red, there is complacency in the market. There are too many bulls and this is when market advances stall.
Currently, the value of the indicator is 67.53%. This is the highest value in 9 years. Values greater than 58% (arbitrarily chosen) are associated with market tops, and the red dots over the price bars indicate such.
Figure 4. Rydex Total Bull v. Total Bear/ weekly
Shorter term Rydex measures continue to suggest excessive bullishness. This data, which has proved to be very actionable, is available as Premium Content. This service should help you improve your market timing.
By Guy Lerner
http://thetechnicaltakedotcom.blogspot.com/
Guy M. Lerner, MD is the founder of ARL Advisers, LLC and managing partner of ARL Investment Partners, L.P. Dr. Lerner utilizes a research driven approach to determine those factors which lead to sustainable moves in the markets. He has developed many proprietary tools and trading models in his quest to outperform. Over the past four years, Lerner has shared his innovative approach with the readers of RealMoney.com and TheStreet.com as a featured columnist. He has been a regular guest on the Money Man Radio Show, DEX-TV, routinely published in the some of the most widely-read financial publications and has been a marquee speaker at financial seminars around the world.
© 2010 Copyright Guy Lerner - All Rights Reserved
Disclaimer: The above is a matter of opinion provided for general information purposes only and is not intended as investment advice. Information and analysis above are derived from sources and utilising methods believed to be reliable, but we cannot accept responsibility for any losses you may incur as a result of this analysis. Individuals should consult with their personal financial advisors.
Guy Lerner Archive |
© 2005-2022 http://www.MarketOracle.co.uk - The Market Oracle is a FREE Daily Financial Markets Analysis & Forecasting online publication.