Bank Credit and Monetary Inflation Impact on Gold
Commodities / Gold and Silver 2010 Apr 19, 2010 - 12:12 PM GMTBy: Ned_W_Schmidt
 One needs only read the story of Goldman Sachs’ creation of CDOs of dubious value to sell to one client while allowing another to short them to understand why Gold has existed as an investment down through the ages. We can not think of one story of kings in times long past that accepted CDOs as payment for taxes. We now know why they usually demanded Gold, or other needed commodities.
Actually, the buyers of this dubious paper should not be suing Goldman Sachs. They should be suing the universities from which they received their MBAs. The value of that education may be in question. How could educated investment professionals purchase for their clients paper assets of questionable value based simply on the advice of a firm’s traders and sales people?

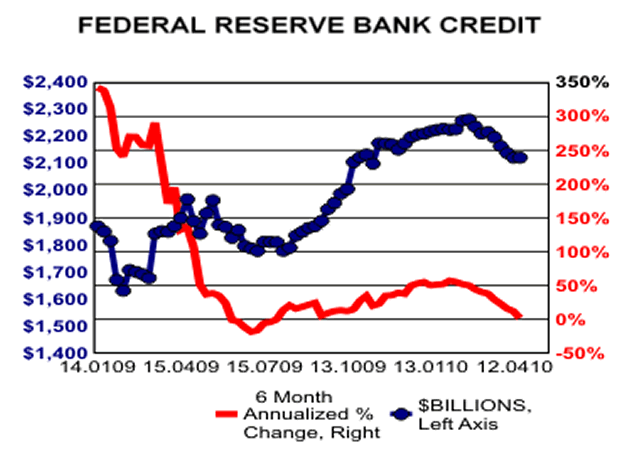
Speaking of players with dubious educations, let us consider the investment actions of the Federal Reserve. In our first graph, above, the blue line is of Federal Reserve Bank Credit. It is the asset side of the Federal Reserve’s balance sheet. From the early part of the graph to the high, the assets of the Federal Reserve expanded by about $600 billion. If we were to back up further in time, we would find that their asset purchases were far greater than that.
A worrisome part of this graph is the more recent experience. Federal Reserve is apparently trying to withdraw some of that massive amount of liquidity that had been injected into U.S. financial system. The worry to which we refer is the red line. It is the six-month rate of change in Federal Reserve credit, annualized. We might refer to that as the rate of monetary liquification.
Rate of monetary liquification is again sitting on the zero line. That reality is making the dollar rarer on a relative base. Given this restrictive and deflationary monetary policy, strength should be expected in the value of the U.S. dollar. That should spill over into the Gold market causing $Gold to continue to languish. Restrictive monetary policy is bullish for U.S. dollar and bearish for Gold.
However, that leads to some important questions. Will the Federal Reserve continue to withdraw liquidity from U.S. financial system, sending U.S. back into recession? Or, will the Federal Reserve now monetize the Obama Regime’s massive deficit? With the U.S. Federal deficit about $1.7 trillion over the past year, debt monetization seems a good bet. Further, given that the U.S. election in November is getting closer by each turn of the calendar, we would suggest that the Federal Reserve will halt their deflationary policies soon.
That massive liquidity injection by the Federal Reserve did not translate into rapid monetary growth in the U.S. as most of us expected. Rather, that liquidity went into the black hole of the mortgage market. With mortgage monetization now fading as a policy goal at the Federal Reserve, the liquidity being provided as part of the monetization of the Obama deficit is flowing to the remainder of the system. The non mortgage sector is receiving what liquidity is being provided the system. The transition away from a fixation on the mortgage sector is starting to influence U.S. monetary trends.

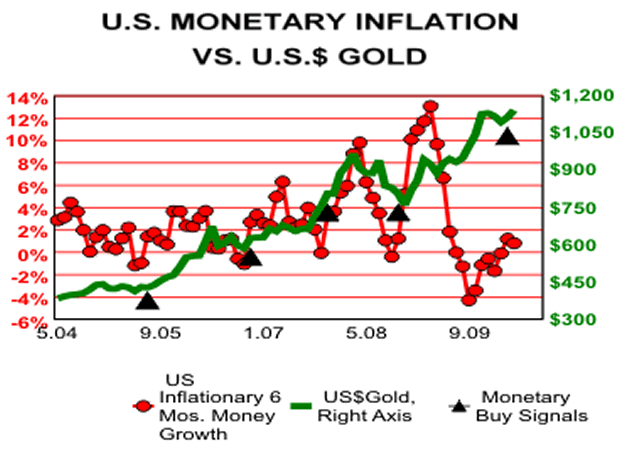
In the above graph, the green line is the monthly average price of $Gold. It uses the right axis. Red line is the inflationary component of U.S. money supply growth rate, M-2 NSA. That measure, which is the annualized six month rate of change, uses the left axis.
Despite the massive injection of liquidity by the Federal Reserve, the inflationary component of U.S. money supply growth plunged from more than 12% into negative territory. Much of the liquidity that had been provided went into the abyss known as the mortgage market. In recent months, the contraction of the U.S. money supply growth rate seems to have been reversed.
As has been marked on the graph with black triangles, this measure can be used to create buy signals on $Gold. When the rate of change in the inflationary component of U.S. money supply growth turns positive from a negative value, a buy signal is created. This is not a market timing indicator. It does not mean the price of $Gold will go up tomorrow. It does mean that U.S. monetary conditions are again returning to being a positive contributor to the price of Gold.
Before monetary factors can push $Gold higher, markets must digest both the volcano and Goldman factors. Think of markets as a giant margin account, as it has been recently. Volcano and Goldman event acts like any reduction in the equity of a margin account. On Friday, when Goldman Sachs stock lost more than $10 billion of value, all markets went down as that slide was the equivalent of a charge to the equity of the markets’ margin account.
Goldman Sacks may simply be a triggering event that converts one small market correction into a swan much darker in color. Some selling, and perhaps even some margin calls, is likely in most of the markets that rallied in past year. Included in that group of correcting markets should be financial equities in particular, oil and Gold. Much of the buying in these groups was asset allocation driven as equity rose in the markets’ margin account. The reversing of that activity is now more likely.
With $Gold having become over bought on fund buying, it is vulnerable to this margin induced selling. What is likely to unfold is a Minor Wave C of Major Wave II for $Gold. A low, possibly down to US$970, should develop by middle of Summer. Gold investors should be all over that low, buying in size. From that point on the dollar will not be worth a Goldman as the Federal Reserve must monetize both the Obama deficit and the nationalization of the U.S. health care system.
By Ned W Schmidt CFA, CEBS
Copyright © 2010 Ned W. Schmidt - All Rights Reserved
GOLD THOUGHTS come from Ned W. Schmidt,CFA,CEBS, publisher of The Value View Gold Report , monthly, and Trading Thoughts , weekly. To receive copies of recent reports, go to www.valueviewgoldreport.com
Ned W Schmidt Archive |
© 2005-2022 http://www.MarketOracle.co.uk - The Market Oracle is a FREE Daily Financial Markets Analysis & Forecasting online publication.


