Gold Broken Support Becomes Resistance and the Palladium Rocket
Commodities / Gold and Silver 2010 Apr 20, 2010 - 03:10 AM GMT Gold was down -24.30 for the week (-2.09%), closing at $1137.30 (continuous contract). GLD (gold trust ETF) lost about 2% as well, closing at 111.24. Just last week, gold had made a new 2010 high. In last week's report I said:
"Gold's daily chart is bullish, but it is also starting to enter overbought territory. Gold has been performing well despite a steady dollar. If the dollar were to correct, it would put a bid under gold. The chart has turned decidedly bullish if price holds the breakout.
The weekly chart is looking up as well, although a positive MACD crossover has not yet occurred, and is necessary, if a sustainable rally is to unfold."
With gold's drop this week, price is seriously testing the validity of the breakout. As the daily chart of GLD shows, horizontal support at 112 has already given way, and support at 110 is being tested. Broken support at 112 has now turned into resistance.
Monday & Tuesday's email alerts warned that gold's price action and candlesticks were indicating waning momentum and indecision; and that a break below 100 by the CCI indicator would suggest a pullback was unfolding.

Thursday's market update discussed that Chaikin Money Flows were negative on the recent breakout, showing distribution, as opposed to accumulation, and that caution was warranted.
The chart below shows both the breakdown of the overbought CCI indicator at the top of the chart, and the negative money flows (CMF) at the bottom of the chart.
Both of these indicators have to turn up immediately for any sustainable rally to occur.
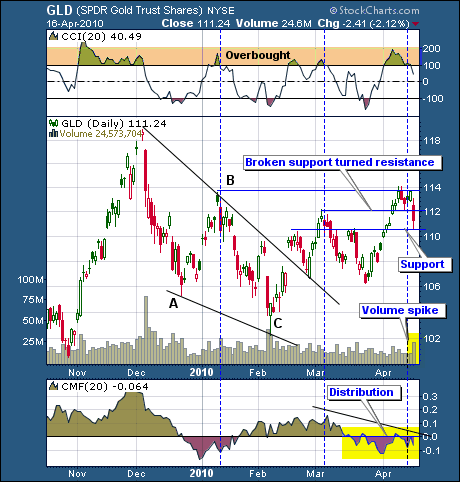
The negative CMF readings show that gold has been under negative distribution during its recent breakout, as opposed to positive accumulation that would provide underlying support.
As I stated last week: "as the chart below shows, the breakout occurred on expanding volume, although volume could have been stronger."
Now, we see why expanding volume is so important on breakouts: it confirms and validates that there is conviction and staying power behind the move. Positive money flows (CMF) does the same.
If price does not hold at present levels, and breaks down further, a failed breakout will be confirmed. It is not a sure thing - yet.
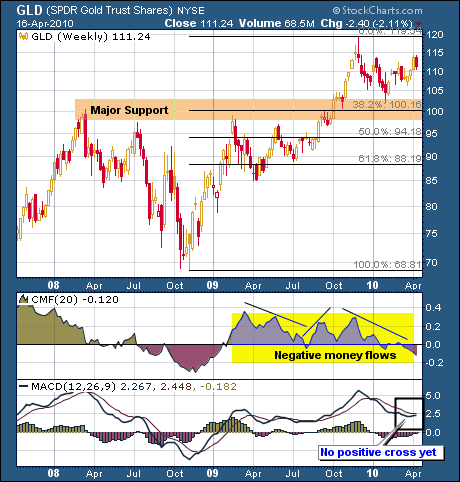
The weekly chart shows that a positive MACD crossover has still not occurred. As stated in last week's report:
 The weekly chart is looking up as well, although a positive MACD crossover has not yet occurred, and is necessary, if a sustainable rally is to unfold.
With gold's fall this past week, a positive crossover is even more important of a factor now. Things need to turn around quickly or they could get much worse. Notice that the weekly money flows (CMF) are negative as well.
The markets have been volatile and anything is possible. One or two days of positive price action can change things drastically.
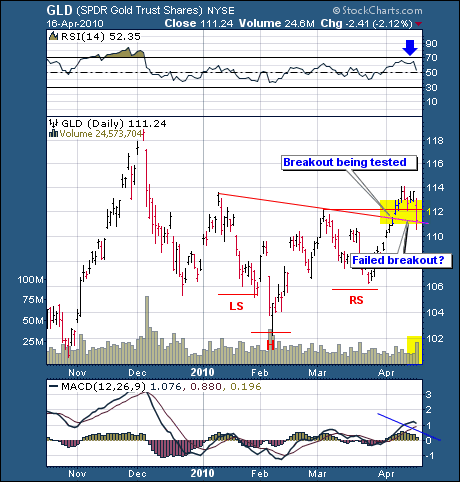
Next up is another daily chart of GLD, which shows the inverse head & shoulders formation that broke out last week.
In last week's report I mentioned that the breakout occurred on expanding volume, but that it could have been stronger. Now, we see why. I also said that:
"The final confirmation will be if broken resistance now becomes and holds as support."
The breakout is already being tested to see if it holds as support. Price is sitting right on top of the breakout area. It is make it or break it time for gold to either confirm or invalidate its recent breakout.
Gold is once again sitting on the fence, which it seems to love to do. Bull markets do whatever they can to throw the rider off. This one is no different, which is why I like to look for what can go wrong, as it usually does.
 Gold will either hold here or break down. A further decline could lead to a test of the $1000 breakout level. This has always remained on the table as a possibility, although until this week, recent price action was making it less likely.
Now, it has returned to the stage. Even if gold breaks down from here, such a test is not a given - it is simply a possibility. Anything is possible when dealing with the markets.
If the dollar falls from here, and the euro were to pop on a strong short covering rally, it is possible that gold could fly from here (see currency section for details & charts). It's just as possible that it tests the $1000 price level; AND numerous other scenarios in-between.
A drop, if it were to occur, to the $1000 level, would be a buying opportunity, as long as that breakout area holds.
Palladium
Palladium bucked the trend of the other precious metals this week and closed up 3.66%. The weekly chart shows palladium closing in on its all-time high from 2008.
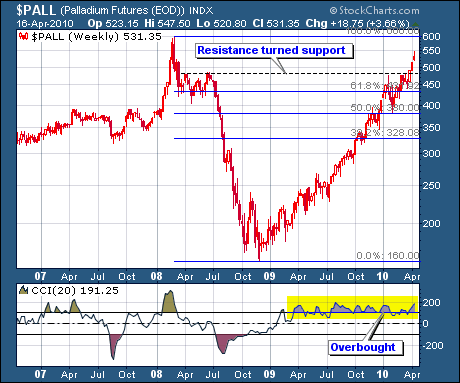
Last week's report showed platinum making new yearly highs. This week it is palladium, which suggests underlying strength in the sector.
 Stillwater Mining (platinum miner) was sold into the recent new highs, per email updates. Profits were booked on IAG, NEM, & GOLD over the past two weeks per email alerts.
Overall stock market risk and the overbought condition of the pm sector, along with negative money flows (CMF) warrants caution at this time. This is gone into further detail in the stock watch list and model portfolio sections of the complete market wrap report available to subscribers only.
The above excerpt is from the latest full-length market wrap report, available on the Honest Money Gold & Silver Report website. All major markets are covered: stocks, bonds, currencies, and commodities, with the emphasis on the precious metals. Our stock watch list provides numerous investment ideas each week and the model portfolio offers a game plan to implement them. A FREE one-month trial subscription is available. Stop by and check it out.
Good luck. Good trading. Good health, and that’s a wrap.

Come visit our website: Honest Money Gold & Silver Report
New Audio-Book Now Available - Honest Money
Douglas V. Gnazzo
Honest Money Gold & Silver Report
About the author: Douglas V. Gnazzo writes for numerous websites and his work appears both here and abroad. Mr. Gnazzo is a listed scholar for the Foundation for the Advancement of Monetary Education (FAME).
Disclaimer: The contents of this article represent the opinions of Douglas V. Gnazzo. Nothing contained herein is intended as investment advice or recommendations for specific investment decisions, and you should not rely on it as such. Douglas V. Gnazzo is not a registered investment advisor. Information and analysis above are derived from sources and using methods believed to be reliable, but Douglas. V. Gnazzo cannot accept responsibility for any trading losses you may incur as a result of your reliance on this analysis and will not be held liable for the consequence of reliance upon any opinion or statement contained herein or any omission. Individuals should consult with their broker and personal financial advisors before engaging in any trading activities. Do your own due diligence regarding personal investment decisions. This article may contain information that is confidential and/or protected by law. The purpose of this article is intended to be used as an educational discussion of the issues involved. Douglas V. Gnazzo is not a lawyer or a legal scholar. Information and analysis derived from the quoted sources are believed to be reliable and are offered in good faith. Only a highly trained and certified and registered legal professional should be regarded as an authority on the issues involved; and all those seeking such an authoritative opinion should do their own due diligence and seek out the advice of a legal professional. Lastly Douglas V. Gnazzo believes that The United States of America is the greatest country on Earth, but that it can yet become greater. This article is written to help facilitate that greater becoming. God Bless America.
Douglas V. Gnazzo © 2010 All Rights Reserved
© 2005-2022 http://www.MarketOracle.co.uk - The Market Oracle is a FREE Daily Financial Markets Analysis & Forecasting online publication.


