


How to Spot Trading Opportunities Free Ebook
InvestorEducation / Learn to Trade Apr 20, 2010 - 02:34 PM GMTBy: EWI

 Dear reader,
Elliott Wave International's free 47-Page eBook, How to Spot Trading Opportunities, is only available free for another 48 hours. Don't miss out on this valuable resource, created from the $129 two-volume set of the same name. The offer expires Friday, April 23. Learn more here and download your free eBook.
The How to Spot Trading Opportunities eBook features 47-pages of easy-to-understand trading techniques that help you identify high-confidence trade setups. Senior EWI Analyst Jeffrey Kennedy will show you how some of the simplest rules and guidelines have some of the most powerful applications for trading. Don’t miss out on this rare opportunity to change the way you trade forever.
Raising The BAR: Bar Patterns & Trading Opportunities
How a 3-in-1 formation in cotton "triggered" the January selloff
For Elliott Wave International's chief commodity analyst Jeffrey Kennedy, the single most important thing for a trader to have is STYLE-- and no, we're not talking business casual versus sporty chic. Trading "style," as in any of the following: top/bottom picker, strictly technical, cyclical, or pattern watcher.
Jeffrey himself is (and always has been) a "trend" trader, meaning: he uses the Wave Principle as his primary tool, with a few secondary means of select technical studies. Such as: Bar Patterns. And Jeffrey counts one bar pattern in particular as his favorite: the 3-in-1.
Here's the gist: The 3-in-1 bar pattern occurs when the price range of the fourth bar (named, the "set-up" bar) engulfs the highs and lows of the last three bars. When prices penetrate above the high -- or -- below the low of the set-up bar, it often signals the resumption of the larger trend. Where this breach occurs is called the "trigger bar." On this, the following diagram offers a clear illustration:
Now, how about a real world example of the 3-1 formation in the recent history of a major commodity market? Well, that's where the picture below comes in. It's a close-up of Cotton from the February 5, 2010 Daily Futures Junctures.
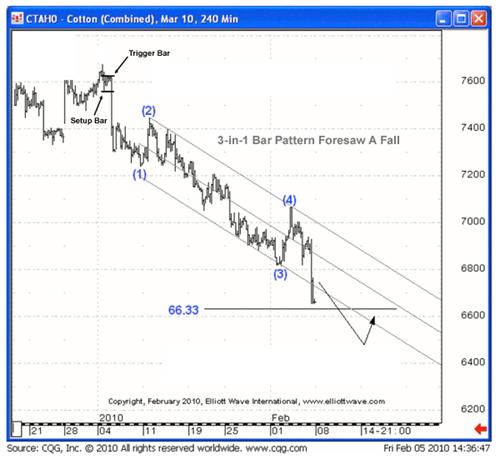
As you can see, a classic 3-in-1 bar pattern emerged in Cotton at the very start of the New Year. Within a few day the trigger bar closed below the low of the set-up bar, signaling the market's return to the downside. Immediately after, cotton prices plunged in a powerful selloff to four-month lows.
February arrived, and with it the end of cotton's decline. In the same chart you can see how Jeffrey used the Wave Principle to calculate a potential downside target for the market at 66.33. This area marked the point where Wave (5) equaled wave (1), a reliable for impulse patterns. Since then a winning streak in cotton has carried prices to new contract highs.
This example shows the power of a fully-equipped technical analysis "toolbox." By using the Wave Principle with Bar Patterns, one has a solid, objective chance of anticipating the trend in volatile markets.
And in a 15-page report titled "How To Use Bar Patterns To Spot Trade Set-ups," Jeffrey Kennedy identifies the top SIX Bar Patterns included in his personal repertoire. They are Double Inside Days, Arrows, Popguns, 3-in-1, Reverse 3-in-1, and Outside-Inside Reversal.
In this comprehensive collection, Jeffrey provides each pattern with a definition, illustrations of its form, lessons on its application and how to incorporate it into Elliott wave analysis, historical examples of its occurrence in major commodity markets, and ultimately -- compelling proof of how it identified swift and sizable moves.
Best of all is, you can read the entire, 15-page report today at absolutely no cost. You read that right. The limited "How To Use Bar Patterns To Spot Trade Setups" is available with any free, Club EWI membership.Nico Isaac writes for Elliott Wave International, a market forecasting and technical analysis firm.
© 2005-2022 http://www.MarketOracle.co.uk - The Market Oracle is a FREE Daily Financial Markets Analysis & Forecasting online publication.