


U.S. Housing Market is a Buy Says Rent Ratios, HAI and Cap Rates
Housing-Market / US Housing Apr 22, 2010 - 01:41 AM GMTBy: Paul_L_Kasriel

 In Wednesdays (April 21) NYT, David Leonhardt writes that rent ratios - the market price of a house divided by the annual rent of a comparable house - are suggesting that in many regions of the country, the purchase of a house makes more economic sense than renting a comparable house (In Sour Home Market, Buying Often Beats Renting).
According to Leonhardt, when the rent ratio is above 20, renting makes more economic sense. When the rent ratio is below 20, a home purchase makes more economic sense. "In many large metropolitan areas, including New York, Los Angeles, Chicago, Houston, Dallas, Atlanta and South Florida, the average ratio is now 16 or lower. It was more than 25 in several of these places at the peak of the bubble, about five years ago."
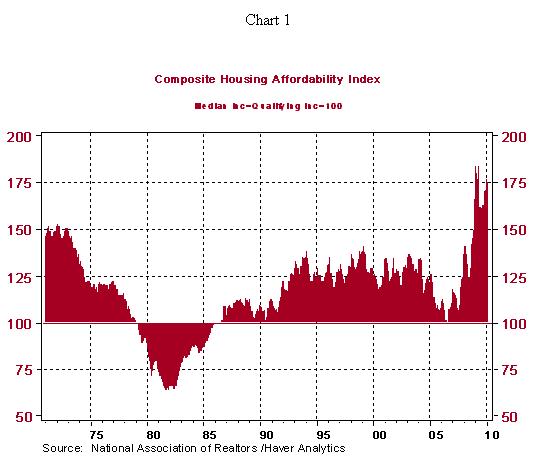
The National Association of Realtors calculates a Housing Affordability Index (HAI). This index is a function of the level of mortgage rates and the ratio of house prices to household income. The lower the level of mortgage rates and the lower the house price-income ratio, the more affordable is a home purchase (i.e., the higher is the value of the HAI). The HAI index =100 when median family income qualifies for an 80% mortgage on a median priced existing single-family home. A rising index indicates more buyers can afford to enter market. Chart 1 shows the history of the HAI from January 1971 through February 2010. The highest reading for the HAI was 184 in January 2009. The February 2010 reading was 176. The HAI is sending a signal similar to the Leonhardt's rent ratio - owner-occupied housing is a buy.
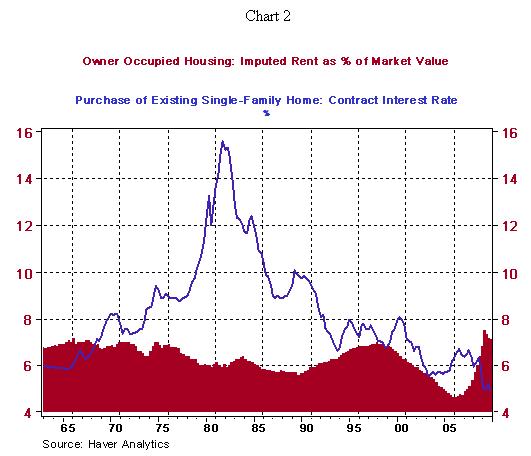
Kasriel has come up with a measure to indicate whether owner-occupied housing is cheap or expensive. The Kasriel measure involves something akin to the "cap" rate on commercial real estate. The cap rate is the ratio between the net operating income produced by an asset and the asset's current market value. Kasriel's cap rate for owner-occupied housing is the ratio of the imputed rent produced by owner-occupied houses in the aggregate to the market value of owner-occupied houses in the aggregate. The imputed rent is available in the BEA National Income Accounts. The market value of owner-occupied housing is available in the Federal Reserve Flow-of-Funds data. Chart 2 shows the "Kasriel Cap Rate" for owner-occupied housing and the level of the contract interest rate on the purchases of existing single-family homes.
The data start in Q1:1963 and end in Q4:2009. Notice that over most of the period, the mortgage rate is above the Kasriel Cap Rate. When this is the case, house prices are "expensive" in that the "yield" on owner-occupied housing is less than the cost of financing the house. In the early to mid 1960s, the Kasriel Cap Rate was above the level of the mortgage rate. And starting in Q3:2009, the Kasriel Cap Rate has been above the level of the mortgage rate. The widest positive differential between the Kasriel Cap Rate and the mortgage rate occurred in Q1:2009 at 246 basis points. In Q4:2009, the differential was 220 basis points.
Now, before running out to buy a house, take a few things into consideration. Firstly, housing could become even "cheaper" if house prices resume their decline as foreclosed houses come on to the market. Secondly, rents, either actual rents on rental houses or imputed rents on owner-occupied houses, could fall. But all in, a house purchase today looks pretty attractive, financially speaking, especially if the contract is signed before April 30.
Paul Kasriel is the recipient of the 2006 Lawrence R. Klein Award for Blue Chip Forecasting Accuracy
by Paul Kasriel
The Northern Trust Company
Economic Research Department - Daily Global Commentary
Copyright © 2010 Paul Kasriel
Paul joined the economic research unit of The Northern Trust Company in 1986 as Vice President and Economist, being named Senior Vice President and Director of Economic Research in 2000. His economic and interest rate forecasts are used both internally and by clients. The accuracy of the Economic Research Department's forecasts has consistently been highly-ranked in the Blue Chip survey of about 50 forecasters over the years. To that point, Paul received the prestigious 2006 Lawrence R. Klein Award for having the most accurate economic forecast among the Blue Chip survey participants for the years 2002 through 2005.
The opinions expressed herein are those of the author and do not necessarily represent the views of The Northern Trust Company. The Northern Trust Company does not warrant the accuracy or completeness of information contained herein, such information is subject to change and is not intended to influence your investment decisions.
Paul L. Kasriel Archive |
© 2005-2022 http://www.MarketOracle.co.uk - The Market Oracle is a FREE Daily Financial Markets Analysis & Forecasting online publication.