


Great Insight Into The Consumer And Retail Stock Sector
Stock-Markets / Sector Analysis Apr 28, 2010 - 02:57 PM GMTBy: Guy_Lerner

 I had the privilege yesterday of receiving an email from Richard Davis of the Consumer Metrics Institute, Inc. Mr. Davis had read my blog post on the SPDR S&P Retail ETF (symbol: XRT), and he has graciously allowed me to post his email below with some very interesting data and insights with regards to the consumer.
Mr. Davis writes that "our mission at the Consumer Metrics Institute is to measure (on a daily basis) exactly how consumers are leading the U. S. economy. We "mine" nation-wide internet consumer tracking databases on a daily basis for early warnings about the demand side of the economy. Our data is significantly upstream economically from the factories and the products measured by the GDP, putting us far ahead of the traditional economic reports. Perhaps our data is too timely; we are so far ahead of conventional economic measures that our story generally differs (either positively or negatively) from the stories being simultaneously reported by more traditional sources."
With regards to the current environment where there appears to be a disconnect between stock prices (i.e., retail sector exceeding the 2007 highs) and what we all see locally when traveling around our cities and towns (i.e., lots of retail space available), Mr. Davis writes: "Recent reports of a strengthening recovery are not fully supported by the behavior of consumers on the web. At the Consumer Metrics Institute we measure the depth and quality of web based consumer "demand" on a daily basis, and during this recovery the year-over-year changes in "demand" that we measure actually peaked in August 2009 and have been declining ever since.
In fact, our "trailing quarter" of web based consumer demand slipped into year-over-year contraction on January 15th, and since then we have been plotting the progress of this 2010 contraction event against the profiles of similar events in 2006 and 2008." This can be seen in figure 1.
Figure 1. Consumer Metric Institute's Contraction Watch
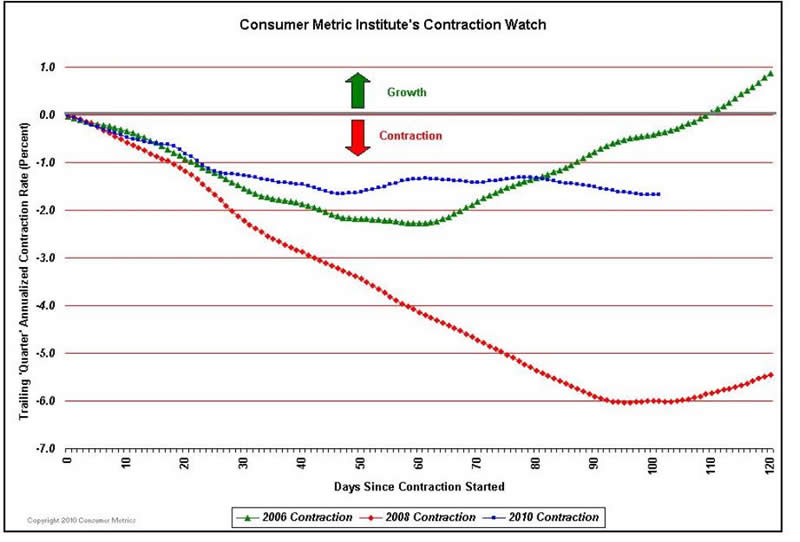
This graph shows the consumer contractions from 2006 (green line), 2008 (red line) and the current contraction (blue line). The x-axis of the graph is "days since the contraction started".
Mr. Davis continues: "As you can see from the above chart the current consumer "demand" contraction event is unique: if there is a "second dip" it may very well be unlike anything we have seen recently. Instead of a "call-911" type of event in 2008 or the "hiccup" witnessed in 2006, we may be seeing a "walking pneumonia" type of contraction that has legs.
Over the most recent 7 quarters our economically "upstream" Daily GrowthIndex has led the "downstream" factory GDP numbers by about 17 weeks. If that pattern continues to hold, we are currently about halfway through the consumer transactions that will drive the third quarter's production and GDP. If the blue line shown in the above chart continues drifting laterally over the next 40 days, the 3rd quarter 2010 GDP will look a lot like what we
have previously projected for the 2nd quarter 2010 GDP, contracting at a mild but persistent rate.
In summary, our data is telling us that U. S. consumers are very reluctant to take on the kind of debt that they have traditionally assumed when pulling the economy out of previous recessions. Even a recent upturn in our retail index faded once the seasonal impact of the forward shifted Easter holiday had passed. Furthermore, even during the Easter retail up-tick the quality of the transactions was not very high. Big ticket items requiring longer term financial commitments were relatively scarce, and for that reason our Weighted Composite and Daily Growth Indexes did not materially respond."
Thanks for sharing the insights and email. Great stuff. To learn more about the indexes of the Consumer Metrics Institute, please go to their website by clicking here: Consumer Metrics Institute. To obtain an overview of their unique, you can retrieve this PDF by clicking here: Overview.
By Guy Lerner
http://thetechnicaltakedotcom.blogspot.com/
Guy M. Lerner, MD is the founder of ARL Advisers, LLC and managing partner of ARL Investment Partners, L.P. Dr. Lerner utilizes a research driven approach to determine those factors which lead to sustainable moves in the markets. He has developed many proprietary tools and trading models in his quest to outperform. Over the past four years, Lerner has shared his innovative approach with the readers of RealMoney.com and TheStreet.com as a featured columnist. He has been a regular guest on the Money Man Radio Show, DEX-TV, routinely published in the some of the most widely-read financial publications and has been a marquee speaker at financial seminars around the world.
© 2010 Copyright Guy Lerner - All Rights Reserved
Disclaimer: The above is a matter of opinion provided for general information purposes only and is not intended as investment advice. Information and analysis above are derived from sources and utilising methods believed to be reliable, but we cannot accept responsibility for any losses you may incur as a result of this analysis. Individuals should consult with their personal financial advisors.
Guy Lerner Archive |
© 2005-2022 http://www.MarketOracle.co.uk - The Market Oracle is a FREE Daily Financial Markets Analysis & Forecasting online publication.