Declining Bank Loans – Write-Downs or Pay-Downs?
Economics / Credit Crisis 2010 Apr 29, 2010 - 11:03 AM GMTBy: Paul_L_Kasriel
 We mentioned in our April 2010 U.S. Economic and Interest Rate Outlook [It's Been A While] that the ongoing contraction in commercial bank lending was an important factor curbing our enthusiasm about near-term growth in U.S. aggregate demand. But we did acknowledge that our lack of optimism might be misplaced if the cause of the continued contraction in bank lending was due more to write-downs of loans gone sour rather than of pay-downs of loans. We argued that if bank loans were falling because the dollar amount of write-downs exceeded the dollar amount of new loans being granted, the write-downs were immaterial with respect to new spending.
The spending with respect to the bank loans now being written down occurred in the past, when the loans were originally granted. If, however, bank loans were now falling because the dollar amount of pay-downs exceeded the dollar amount of new loans being granted, then this would have negative implications for near-term aggregate demand. The entities paying down their debt would be cutting back on their current spending.
When we wrote that April outlook, we did not know how to determine whether write-downs or pay-downs were dominating the behavior of bank loans. One of our readers, Jim Fickett, who publishes an investment commentary called "ClearOnMoney", showed us how to make the distinction. Fickett pointed out to us that, by definition:
(1) $ change in bank loans = $ amount of new loans - $ amount of pay-downs - $ amount of write-downs.
Although there are no data on pay-downs, there are Federal Reserve data on loan charge-offs (i.e., write-downs.). If the terms of the identity are re-arranged, we find that:
(2) $ change in bank loans + $ amount of write-downs = $ amount of new loans - $ amount of pay-downs.
So, if the sum of the dollar change in bank loans/leases plus the dollar amount of charge-offs, i.e., the left-hand side of identity (2), is negative, then, by definition, the difference between the dollar amount of new loans granted minus the dollar amount of pay-downs, i.e., the right-hand side of identity (2), must also be negative. And if this is the case, then the dollar amount of pay-downs must exceed the dollar amount of new loans granted.
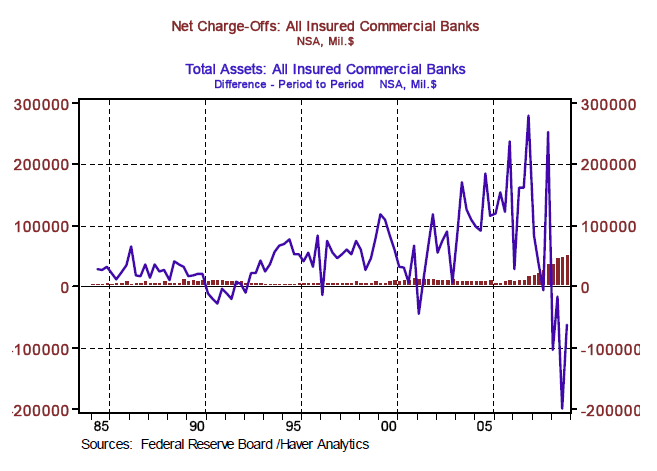
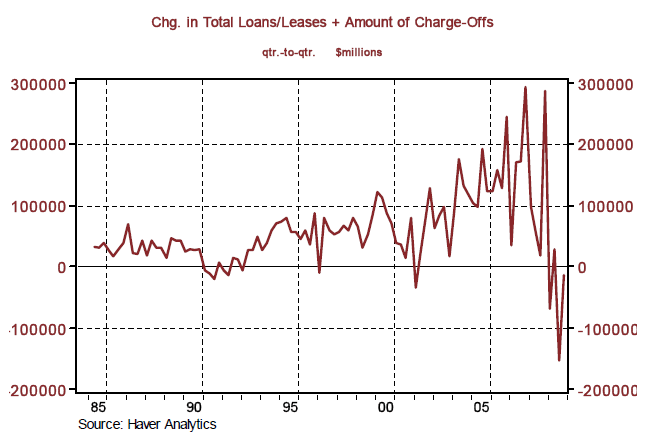
Let's go to the data. Chart 1 shows the quarterly dollar amount of net charge-offs on commercial bank loans/leases and the quarterly dollar change in commercial bank loans/leases. In Q4:2009, net charge-offs totaled $49,363 million and bank loans/leases contracted by $62,321 million. In Chart 2, the dollar amount of net charge-offs is added to the dollar change in bank loans/leases, which is the left-hand side of identity (2). In Q4:2009, this sum was minus $12,958 million. From identity (2), this also means that the dollar amount of loan pay-downs exceeded the dollar amount of new loans granted by $12, 958 million.
Chart 1

Chart 2

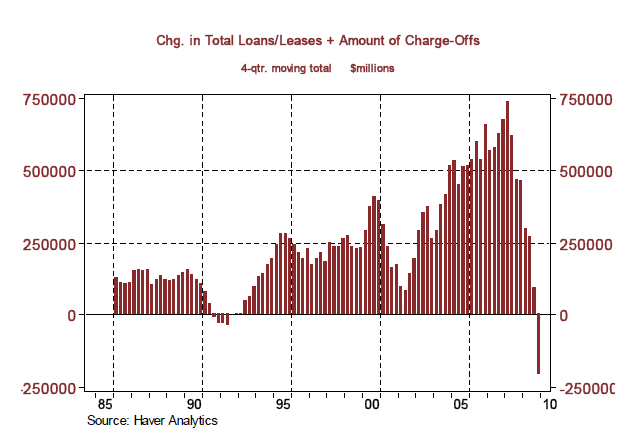
Chart 3 shows the sum of the dollar change in bank loans/leases plus the dollar amount of net charge-offs on a four quarter moving total basis. In the four quarters ended Q4:2009, the sum of the change in bank loans/leases plus net charge-offs was minus $205,135 million. Thus, according to identity (2), the amount of pay-downs exceeded the amount of new loans granted by $205,135 million.
Chart 3

The upshot of all this is that the record decline in commercial bank loans/leases that the U.S. experienced in 2009 was dominated by pay-downs of loans rather than write-offs. Pay-downs have negative implications for new aggregate demand whereas write-downs are irrelevant (at least directly) with regard to new aggregate demand. Write-downs do have indirect negative implications for new aggregate demand to the degree that write-downs result in the reduction of bank capital.
The decline in capital limits the ability of banks to create new credit. This might explain why banks allowed their outstanding loan balances to contract net of write-downs. The continued contraction in commercial bank loan/lease balances is cause for caution with regard to the near-term growth in economic activity.
Paul Kasriel is the recipient of the 2006 Lawrence R. Klein Award for Blue Chip Forecasting Accuracy
by Paul Kasriel
The Northern Trust Company
Economic Research Department - Daily Global Commentary
Copyright © 2010 Paul Kasriel
Paul joined the economic research unit of The Northern Trust Company in 1986 as Vice President and Economist, being named Senior Vice President and Director of Economic Research in 2000. His economic and interest rate forecasts are used both internally and by clients. The accuracy of the Economic Research Department's forecasts has consistently been highly-ranked in the Blue Chip survey of about 50 forecasters over the years. To that point, Paul received the prestigious 2006 Lawrence R. Klein Award for having the most accurate economic forecast among the Blue Chip survey participants for the years 2002 through 2005.
The opinions expressed herein are those of the author and do not necessarily represent the views of The Northern Trust Company. The Northern Trust Company does not warrant the accuracy or completeness of information contained herein, such information is subject to change and is not intended to influence your investment decisions.
Paul L. Kasriel Archive |
© 2005-2022 http://www.MarketOracle.co.uk - The Market Oracle is a FREE Daily Financial Markets Analysis & Forecasting online publication.


