


Stock Market Update: And the Beat Goes On…
Stock-Markets / US Stock Markets Aug 25, 2007 - 09:52 PM GMTBy: Dominick
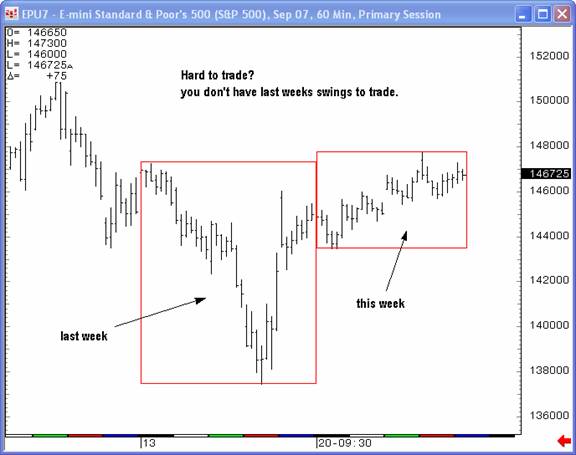
 Discipline and patience is what you need to trade a market like we saw this past week, if you trade it at all – the discipline to focus on what the market's saying is important, and the patience to let the trade set up. The past few updates have emphasized staying flat in a choppy, sloppy, trendless market, if no other reason than to wait for a clear trade. I made that point in a chart on Friday, just as we were getting ready to buy one of the only real moves of the week.
The whole point of being patient is that the charts we trade at TTC are not random; they give us the advantage of trading the market, not our bias, and they make us money. If you follow the media all you find is lots of random speculation and contradictory signals that can get you lost and frustrated. And what's worse, they can lose you money.
If you paid attention to the TV or the internet this week, you would have heard all sorts of supposed technicians and traders making all kinds of irrelevant claims and trying to sell their counts:
“The top is in, of course, what else would it be?” “The four-year low was just put in, what else would it be?” “A3 rd of a 3 rd of a 3 rd is next.” “Sure is, but to the UP side.” “No, we're in a larger correction and the low is only half the correction so far.”
Does anyone really make any money out of all this fuss? I can't see how but it has continues week after week:
“We might have a few more days as we wait for a Bradley turn.” “Wait, Bradley doesn't work, it's the four-year low that's pushing up.” “Guys, it's the 10, 20 40 80, 120-week combo we're waiting for.” “You mean it's not the 3,5,8,13,21,35,55,89,144 Fibonacci week cycle that works?” “No, no, it's the 30,45,90,120 Gann dates that are hitting, don't be silly.” “You mean it's not the Delta that I'm trying to learn out for the last two years?”
To me, having this all in your mind does more damage than good. Most of the time this will confuse you and create analysis paralysis, causing you not to trade.
And it's exactly the same when it comes to the fundamentals– whether it's the doom-and-gloomers or the permabulls, both try to tell you exactly what's going to happen. Is everyone in the U.S. really going to lose their house in the next few days? Is the government really going to knock on your door and take all your gold away, including teeth? Maybe the bulls are being complacent, but the bears think we'll be dropping 400 points on the S&P any day here. Really? If you trade on any of this kind of pseudo-information, all you're doing is picking a side and trading your bias.
So the question is what's really important, what moves the markets? Some say the Fed will cut, others say no way. So, then is it all about oil? The dollar? How many Ipods Apple sells? What Bill Poole says? Is it Mars, Uranus or Pluto that determines who's buying and selling? Pluto isn't even a planet anymore!
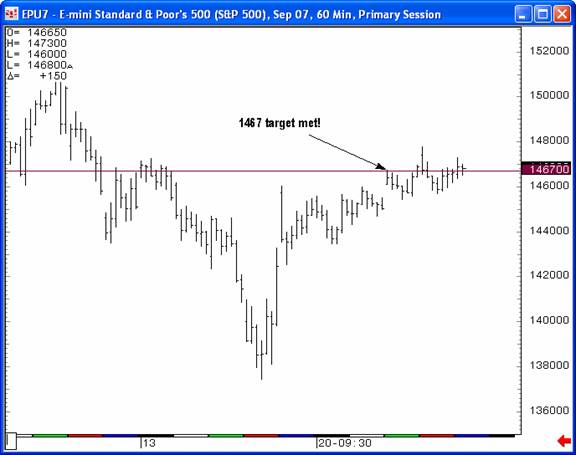
At TTC we simply did it the boring way and bought the low on this trendline from last week, which lined up with the 1360/1370 area we wanted to buy. We placed our stops in case we were wrong, and then used out proprietary 1467 target as the TMAR (take the money and run) trade for up to 90 points or more.
Once our target was hit and our profits booked, there was little harm in staying flat for a few days as the market churned and brokers took commissions from anyone over-thinking and over-trading the sideways market. The chart below shows the vibration around our 1467 number, yet more evidence for members that the methods we practice and the numbers we trade are hardly random.
So, the discipline was trading our charts and our numbers. As a sloppy market bounced around our target, even before the next move, we had meaningful numbers above and below. The patience was waiting for the next setup, and what we were looking for was a trending market moving away from 1467, in either direction. That, my friends, is unbiased trading.
Early on, Friday didn't look like it was shaping up to be much different than the previous few days, but we had the chart below showing an ending diagonal with a clear target. The pattern needed 1471 to be taken out in order to be in effect, but with 1467 in mind, we knew that nothing above our previous target level could be considered for a short trade.
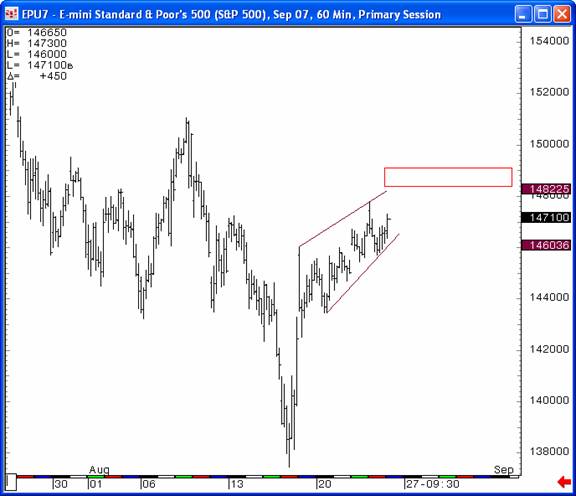
As 1471 was hit and taken out, we refined our upside target with the chart below. Notice that even here we maintain a level at which point we'd admit the ending diagonal was incorrect and adjust our targets accordingly.
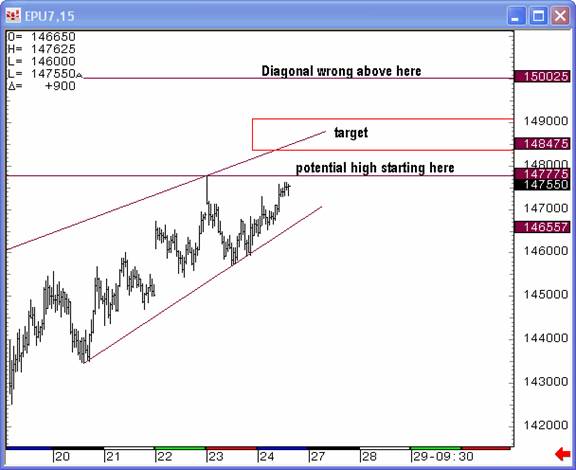
As you probably know, the day ended at 1483 shortly after bumping the bottom edge of the target box. The ending diagonal pattern suggests a reversal ahead, but, before you start selling September 700-strike calls, remember there's still ten points of upside possible within the target on this chart. Members will have our RSI indicator to help them time the trade. And then again, maybe it's not an ending diagonal at all.
The point is that yet, especially after vibrating around 1467 all week, it should be clear the numbers we trade obviously aren't random. No doubt, the cacophony of analysts and commentators in the media will continue with all their silly contradictions and mumbo jumbo. But the question will still be the same: what is important, what's moving the markets? What will you be trading?
Members
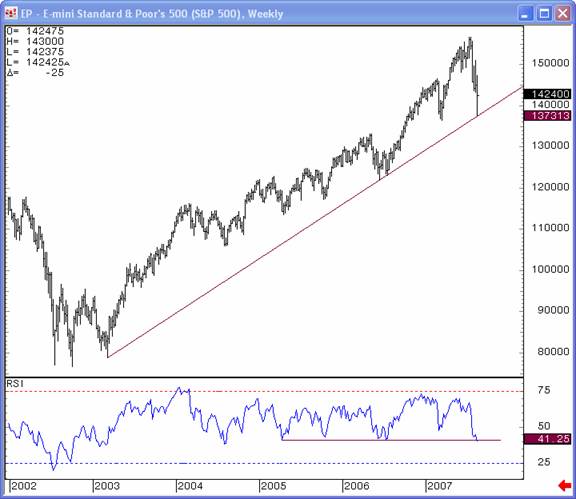
Finally, be sure to check out our weekly “road maps” as that's where the real big picture shapes up, where we compile charts of any market that talks to us, ranging from a look at the last few weeks to huge timeframes all the way back to the 1900's.
‘ Non-members
This update is a nice read, but it can't compare to these road maps. If you would like to take a peek at not only those charts, but stay the whole week with a full refund if we don't suit your needs, join and cancel within a week for a full refund! Join now and after staying a week within all the forums and live chat room it's simply not what you need, email me and ask for a full refund. You won't find an offer like that anywhere else. Offer ends September 30 th , 2007
Have a profitable and safe week trading, and remember:
“Unbiased Elliott Wave works!”
By Dominick
For real-time analysis, become a member for only $50
If you've enjoyed this article, signup for Market Updates , our monthly newsletter, and, for more immediate analysis and market reaction, view my work and the charts exchanged between our seasoned traders in TradingtheCharts forum . Continued success has inspired expansion of the “open access to non subscribers” forums, and our Market Advisory members and I have agreed to post our work in these forums periodically. Explore services from Wall Street's best, including Jim Curry, Tim Ords, Glen Neely, Richard Rhodes, Andre Gratian, Bob Carver, Eric Hadik, Chartsedge, Elliott today, Stock Barometer, Harry Boxer, Mike Paulenoff and others. Try them all, subscribe to the ones that suit your style, and accelerate your trading profits! These forums are on the top of the homepage at Trading the Charts. Market analysts are always welcome to contribute to the Forum or newsletter. Email me @ Dominick@tradingthecharts.com if you have any interest.
This update is provided as general information and is not an investment recommendation. TTC accepts no liability whatsoever for any losses resulting from action taken based on the contents of its charts, commentaries, or price data. Securities and commodities markets involve inherent risk and not all positions are suitable for each individual. Check with your licensed financial advisor or broker prior to taking any action.
Dominick Archive |
© 2005-2022 http://www.MarketOracle.co.uk - The Market Oracle is a FREE Daily Financial Markets Analysis & Forecasting online publication.