


Global Financial Markets Analysis - Technically Precious with Merv
Stock-Markets / Global Stock Markets Sep 01, 2007 - 06:04 PM GMTBy: Merv_Burak

It's been a quiet week in the precious metals. The action has been basically lateral with some upward bias. Friday was good but probably with little volume. So, this week I thought I'd go into something different and just take a quick review of the some markets around the globe.
GOLD
Let's just take a quick look at gold and get it out of the way.
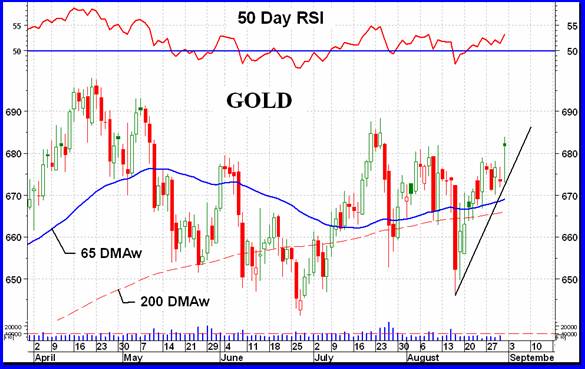
It's been basically a lateral move during the week. Friday saw a sharp upward move but I suspect the volume was very low as most professionals probably took off for an early long week-end. I have no reason to really change my last week's analysis. Apply it to this week. The early part of the trading week should provide a better idea as to the direction for gold over the next while.
SOMETHING DIFFERENT (for Technically Precious with Merv)
Let's take a quickie tour through the global markets this week.
United States of America
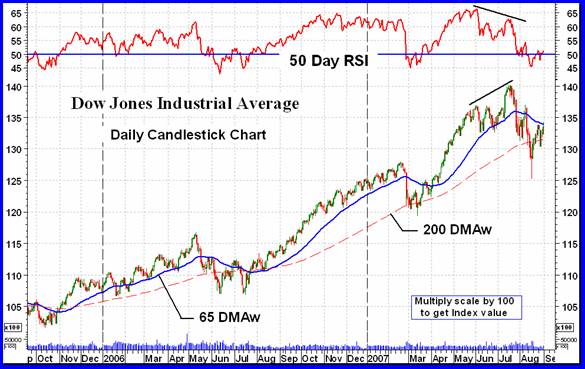
There are several market Indices that are quite common in the U.S. as far as getting an idea as to what's happening in their market. The more common are the Dow Jones Industrial Average and the Standard and Poor's 500 Composite Index. Let's look in at the venerable Dow.
The Dow has been on a binge for some time now. The latest bull move started in Oct of 2005 with a couple of rest periods along the way. Notice the lows in the momentum indicator at the previous price bottoms. The low a week ago was at the same level. Now the question, will we get the same rally as we have before? I'm of a mind that this time there will be no rally to new highs, at least not before we get some further lows. This time we have had a significant weakening in the momentum prior to the drop and such drop may not have worked itself out yet. I could be wrong (often am) but that's the way I see it.
Canada
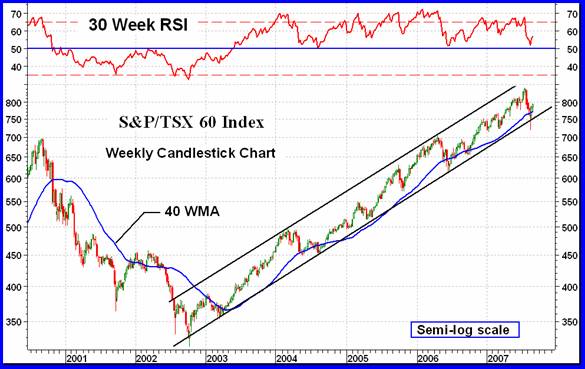
Shown is the S&P/TSX 60 Index. It can be described as Canada 's equivalent to the Dow but with 60 component stocks versus the Dow's 30. The S&P/TSX has been in a steady up trend since reaching a bottom in 2002. The action has been confined to a relatively narrow up trending channel on a semi-log scale chart. The question here is, will it continue in the channel? The long term momentum indicator shown in the chart has been in the positive zone since the start of the bull move. However, the momentum has been showing significant weakness over the past several months and this may eventually result in a turn around by the Index. Nothing lasts forever. One would be on guard for the momentum moving into its negative zone while the Index moves decisively below its lower channel trend line.
China
There are two major China Exchanges plus the Hong Kong (which I usually consider separately). Let's look in on the Shanghai Composite Index.
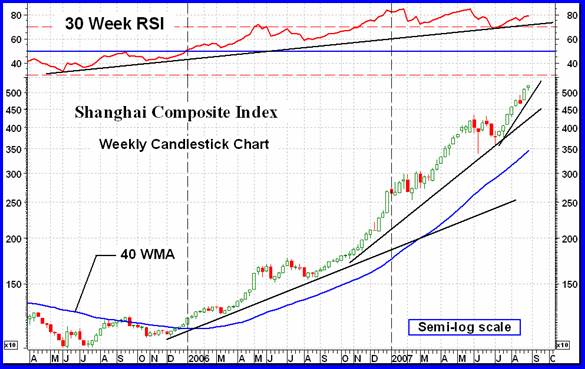
If you have been wondering what's fueling the commodity world there is no better picture than to show the performance of the Chinese economy, here represented by the Shanghai Composite Index. Over 400% gain in less than two and a half years. Now, that's performance. However, two things strike me in this chart. First, as with the other Indices, the momentum indicator is giving us a warning by being weaker than the price action. It is still quite high inside its positive zone so there is no danger of going bearish soon but the warning could mean a slow down or rest period for the Index. The other thing of note is the possibility of an accelerating bearish FAN trend lines. We just might be in the “blow-off” stage. If so, a crossing below the third FAN trend line may signal the end of this bull, at least for a while.
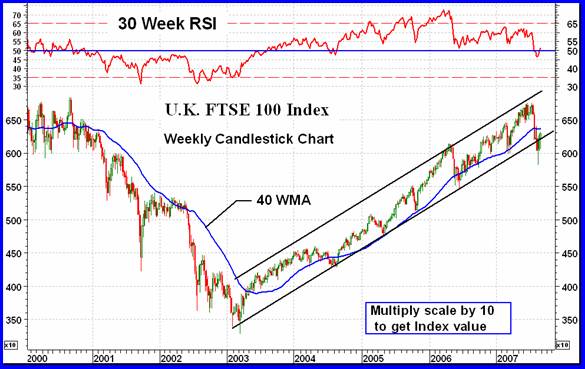
United Kingdom
I'm going to have to get out my geography book. Is it United Kingdom or England or Great Britain or what? Anyway, it's the FTSE 100 Index that we look in on here. As we had seen with the Canadian Index, the FTSE is also trapped in an upward trending channel, only here it is in a normal (geometric) scale chart. The latest action seems to want to break down below the trend but we'll need a close below the support at 6000 to be final. The momentum indicator has been warning of weakness behind the Index action over the past several months. It had dropped below the neutral line but it has been there before. More convincing is a drop by the indicator to the 45% level.
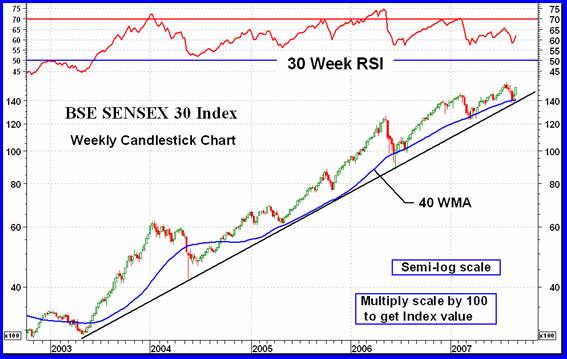
India
The Bombay Stock exchange (Mumbai) has its equivalent to the Dow with 30 component stocks. The BSE SENSEX 30 Index is shown below. As with so many Indices this Index has had a good run for the past several years. However, the long term momentum indicator is screaming BEWARE. The two new highs during 2007 have been made on increasingly lower momentum. The strength behind the Index move is deteriorating. At some point the turn WILL come, but when. I would watch that 14000 level very carefully.
Isreal
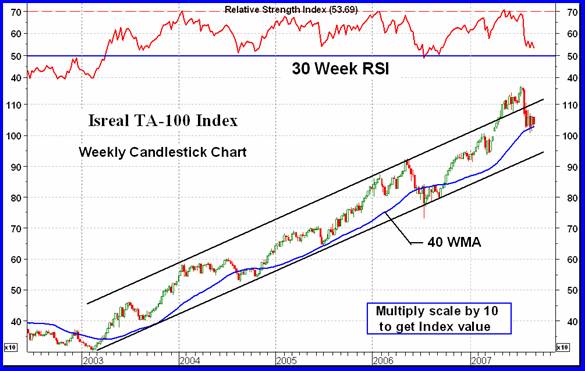
They all seem to look the same, several year up trends, some inside well defined channels, positive long term momentum indicators that seem to be in serious weakness, etc. All that can be said for the TA-100 Index. The one difference here is, however, that the latest action is still near the upper channel line rather than the lower line.
Brazil
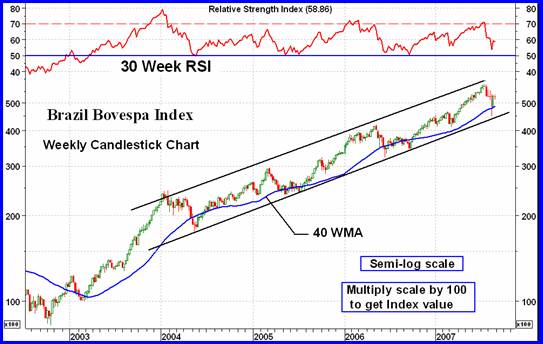
More of the same. Long term up trend. Weak momentum. Channel. Etc.
GLOBAL MARKETS
As we see, from almost every part of the globe we get a similar picture. Several year bull markets still in progress. Long term momentum indicators are warning of deteriorating strength behind the moves. Are we getting ready for a global collapse in the markets? Interesting weeks ahead.
Next week we will be back to the precious metals again.
That's it for this week. I hope you enjoyed this little bit of deviation from the norm.
By Merv Burak, CMT
Hudson Aero/Systems Inc.
Technical Information Group
for Merv's Precious Metals Central
Web: www.themarkettraders.com
e-mail: merv@themarkettraders.com
During the day Merv practices his engineering profession as a Consulting Aerospace Engineer. Once the sun goes down and night descends upon the earth Merv dons his other hat as a Chartered Market Technician ( CMT ) and tries to decipher what's going on in the securities markets. As an underground surveyor in the gold mines of Canada 's Northwest Territories in his youth, Merv has a soft spot for the gold industry and has developed several Gold Indices reflecting different aspects of the industry. As a basically lazy individual Merv's driving focus is to KEEP IT SIMPLE .
To find out more about Merv's various Gold Indices and component stocks, please visit www.themarkettraders.com and click on Merv's Precious Metals Central . There you will find samples of the Indices and their component stocks plus other publications of interest to gold investors. While at the themarkettraders.com web site please take the time to check out the Energy Central site and the various Merv's Energy Tables for the most comprehensive survey of energy stocks on the internet. Before you invest, Always check your market timing with a Qualified Professional Market Technician
Merv Burak Archive |
© 2005-2022 http://www.MarketOracle.co.uk - The Market Oracle is a FREE Daily Financial Markets Analysis & Forecasting online publication.