


A Look at Some Stock Market Echoes and Gold Stocks
Stock-Markets / Financial Markets 2010 Jun 04, 2010 - 02:54 PM GMTBy: Clif_Droke

 I'd like to return to a theme we were discussing last week concerning our expectations for this year's upcoming 4-year cycle bottom. We touched on this in a recent commentary and we'll discuss it some more here. The theme I'd like to emphasize is that in years when the 4-year cycle bottoms (which always occurs in late September/early October) and the stock market takes a significant hit prior to the 4-year cycle time low, the bottom is in most cases made well before the late September/early October period and the market usually ends up outperforming for the rest of the year.
For instance, the last time the 4-year cycle bottomed in October 2006, the S&P barely even acknowledged the cycle low as stocks were on a rip-and-tear after a particularly hard correction in the spring of that year. I think we might have seen something similar with last month’s panic sell-off. This correction was sorely needed and will do much to clear the air, so to speak. The market, once it completely stabilizes, will be able to proceed into the critical summer months on a much sounder footing now and the dominant path for stock prices in the months ahead will most likely be higher.
Last summer we published a report entitled, "Echoes of the Kress Cycles." In it we examined the principle espoused by Mr. Kress himself that traders and investors can get a good feel for what the year ahead will hold out in terms of stock price performance by looking back six years, 10 years, 30 years and 60 years and taking a composite of those four "cycles" (although these aren't cycles in the truest sense). When we examine the closest of these periods we arrive back at the year 2004 six years ago. The year 2004 isn't analogous to this one since the Kress 10-year cycle was down hard that year. However, there were some similarities between that year and this one. One of them was that the SPX took a rather significant hit in the early May period before finding support near its 30-week moving average, much as what is happening now.
Next we go back 10 years to the year 2000. That year was similar to 2010 in that the 10-year cycle had peaked the previous year and the stocks that comprised the Dow Jones Industrial Average (DJIA) were in a sort of "no man's land" and spent the year in a lateral trading range. I use the DJIA for the year 2000 comparison since the Dow was more nearly representative of the broad market at that time and was less burdened with Internet stocks like the S&P. Other than the cyclical comparisons, there really isn't much in the year 2000 to commend itself to the present and there are many more dissimilarities between 2000 and 2010 than similarities. At that time, the Fed's tight money policy had been underway since 1999 and was only just starting to take its toll on stocks and the economy. This time around we've already paid for the sins of the Fed's tight money policy of 2004-2007 and a far looser monetary policy prevails. The Fed's interest rate and adjusted reserves are much more benign and eventually the economy will respond favorably to it.
Back to our "echo" analysis, let's go back 30 years to the year 1980. There was a nasty decline into late April that year but the Dow soon found bottom and rocketed back above the 30-week moving average. The Dow spent the May-August period in an uptrend before consolidating in a broadening type pattern for the rest of the year, closing near its high for the year.
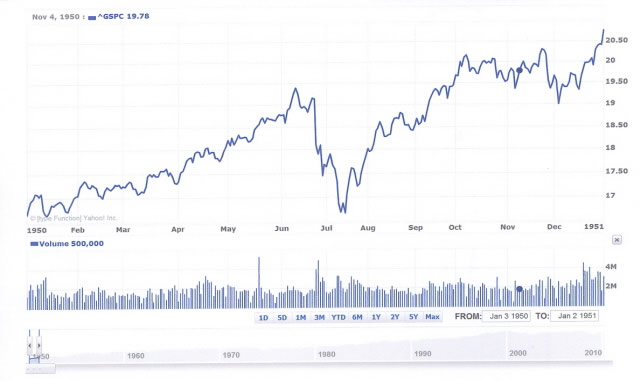
Finally we come to the 60-year echo of 1950. Of all the years covered in this echo analysis, 1950 is the one most closely analogous to 2010. The 10-year cycle had peaked in late 1949, just as it did in late '09. The 4-year cycle bottomed in late September that year, just as it will this year. The stock market took a sharp dive in June-July of 1950, equally as sharp as the one we just witnessed. From there the S&P roared back to higher highs and finished 1950 on its high for the year.
If we combine all four of these "echoes" we get a composite reading of a market with more or less upward bias interspersed with periods of lateral congestion or trading ranges. All four periods had in common a sharp corrective decline, most of them coming in the first half of the year. But all four years also saw a strong bounce back in the months following the panic selling. Earnings growth momentum and monetary measures – including bank credit rate of change, of which we’ll have more to say in upcoming reports – suggest we could see a repetition of this pattern.
Gold mining stocks
As discussed in the previous commentary, the leading indicator stocks Inmet Mining (IMN:TSX) Freeport McMoRan Copper & Gold (FCX) were among the first of the major mining shares to go into decline back in April in anticipation of the general gold stock correction; they should also be among the first to bottom out ahead of the general gold stock group. This appears to be happening in both stocks and FCX isn’t far from confirming an immediate-term bottom.
Let’s examine the internal momentum configuration for the gold stock group. A sustainable turnaround rally in the gold stocks will always be accompanied by an upswing in the immediate-term internal momentum indicators of the GOLDMO indicator series. Here’s what the immediate-term indicators look like as of Thursday.
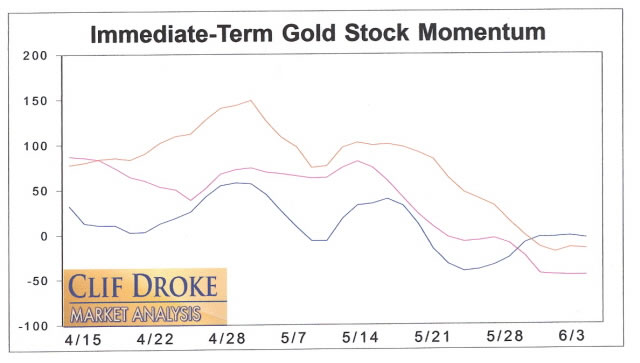
As you can see there is definitely room for improvement and the indicators are telling us the turnaround doesn’t have enough momentum behind it yet to be sustainable. If the XAU Gold Silver Index remains above the recent correction low for a few more days, however, the internal rate of change should improve enough for the recovery to gain traction.
Chart pattern trading techniques
The ability to read chart patterns is one of the most important skills a trader or investor can own. By a skillful application of chart reading methods, you eliminate the need for countless hours of scouring the balance sheets of companies for potential investment quality stocks. Good chart reading skills empower you to focus on stocks that have the best prospects for generating investment returns for short- or intermediate-term trading. For those with a fundamental approach, basic chart reading skills can also give you a “leg up” in identifying stocks with investment quality potential, which can then be supplemented by sound fundamental analysis.
While there are many resources available for learning how to read chart patterns, most are just repetitions of the simplistic techniques taught by the pioneers of technical market analysis, Edwards & Magee. This basic form of chart reading is a good place to start, but it won’t enable you to achieve maximum success in selecting the highest returning trading opportunities in the stock market. For that, you need something extra, namely the ability to gauge whether the stock you wish to trade has internal momentum in its favor or not. This is the “missing ingredient” in most forms of chart pattern analysis and it explains why most chart readers experience only sporadic success at best.
In my book, “How to Read Chart Patterns for Greater Profits,” I explain how to make internal momentum work for you and how to integrate momentum analysis with sound chart reading techniques. The techniques revealed in this book will put you in the driver’s seat and will help you to profit from the many opportunities awaiting you in the financial markets. Stock trading is a sure road to achieving capital gains, but only if you know how to read and act on the market’s signals. “How to Read Chart Patterns for Greater Profits” will put you on the path to success in the market and will give you a huge advantage over the average trader.
The book was written so that retail traders might be able to understand and practically apply these useful methods of market analysis. The book is now available for sale at:http://www.clifdroke.com/books/readingchartpatterns.mgi
By Clif Droke
www.clifdroke.com
Clif Droke is the editor of the daily Gold & Silver Stock Report. Published daily since 2002, the report provides forecasts and analysis of the leading gold, silver, uranium and energy stocks from a short-term technical standpoint. He is also the author of numerous books, including 'How to Read Chart Patterns for Greater Profits.' For more information visit www.clifdroke.com
Clif Droke Archive |
© 2005-2022 http://www.MarketOracle.co.uk - The Market Oracle is a FREE Daily Financial Markets Analysis & Forecasting online publication.