


U.S. Real Jobs Only Increase by 20,000, Unemployment Dips to 9.7%
Economics / Employment Jun 05, 2010 - 01:36 AM GMTBy: Mike_Shedlock

 This morning the BLS reported an increase of 431,000 jobs. 411,000 of those jobs were temporary workers for Census 2010. Headline unemployment fell .2% to 9.7%.
Hidden beneath the surface the BLS Black Box - Birth Death Model added 215,000 jobs.
However, as I have pointed out many times before, the Birth/Death numbers cannot be subtracted straight up to get a raw number. It contributed to this month's employment total for sure, but the BLS will not disclose by how much.
In addition to census hiring, temporary help services employment added 31,000 jobs. temporary help services employment has risen by 362,000 since September 2009.
On the whole, this was a very weak jobs report especially with all the hype coming from various administration officials and economic cheerleaders.
Both the birth/death numbers and temporary help jobs are problematic.
The drop in the unemployment rate will all be taken back by August when the census workers are let go.
As I said last month, I still do not think the top in the unemployment rate is in and expect it may rise substantially June through August, and keep rising at a modest pace thereafter for most of the rest of the year. Time will tell.
Employment and Recessions
Calculated risk has a great chart showing the effects of census hiring as well as the extremely weak hiring in this recovery.
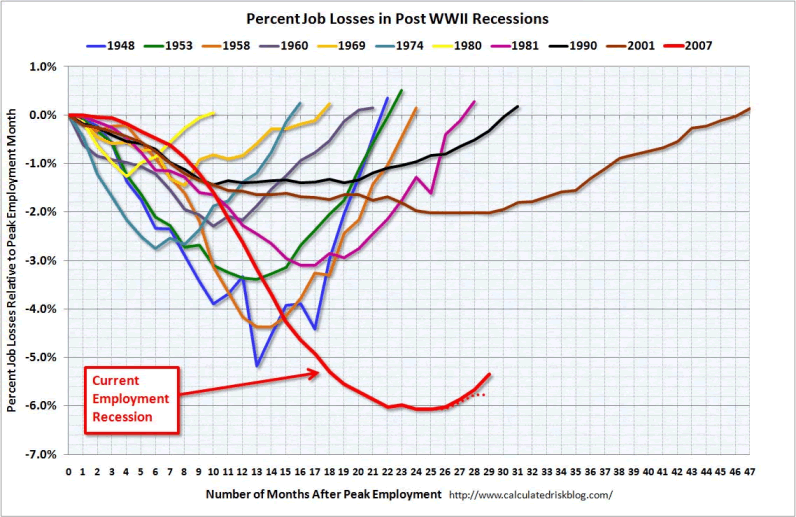
The dotted lines tell the real story about how pathetic a jobs recovery this has been. Bear in mind it has taken $trillions in stimulus to produce this.
May 2010 Report
Please consider the Bureau of Labor Statistics (BLS) May 2010 Employment Report.
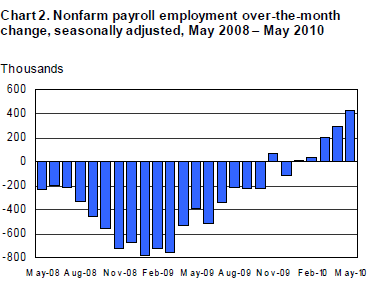
Total nonfarm payroll employment grew by 431,000 in May, reflecting the hiring of 411,000 temporary employees to work on Census 2010, the U.S. Bureau of Labor Statistics reported today. Private-sector employment changed little (+41,000). Manufacturing, temporary help services, and mining added jobs, while construction employment declined. The unemployment rate edged down to 9.7 percent.
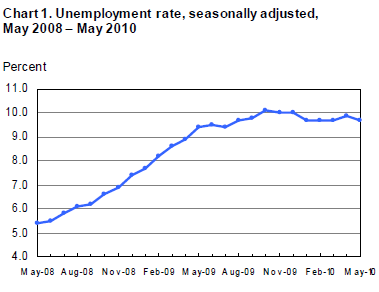
Unemployment Rate - Seasonally Adjusted
Nonfarm Payroll Employment - Seasonally Adjusted
Since September 2009, temporary help services employment has risen by 362,000.
Establishment Data

Highlights
- 431,000 jobs were added
- 35,000 construction jobs were lost
- 29,000 manufacturing jobs were added
- 37,000 service providing jobs were added
- 6,000 retail trade jobs were lost
- 22,000 professional and business services jobs were added
- 17,000 education and health services jobs were added
- 2,000 leisure and hospitality jobs were added
- 390,000 government jobs were added
Note: some of the above categories overlap as shown in the preceding chart, so do not attempt to total them up.
Index of Aggregate Weekly Hours
Production and non-supervisory work hours rose one tick to 33.5 hours and average hourly earnings rose 4 cents.
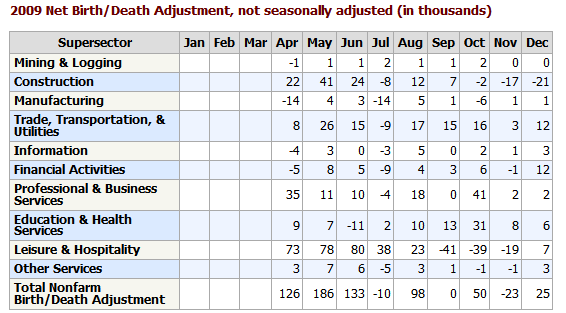
Birth Death Model Revisions 2009
Birth Death Model Revisions 2010
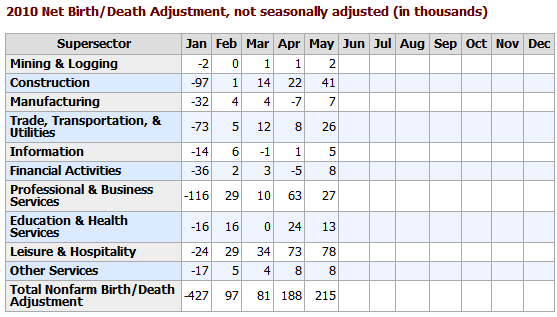
Birth/Death Model Revisions
The BLS Birth/Death Model methodology is so screwed up and there have been so many revisions and up it is pointless to further comment other than to repeat a few general statements.
Please note that one cannot subtract or add birth death revisions to the reported totals and get a meaningful answer. One set of numbers is seasonally adjusted the other is not. In the black box the BLS combines the two coming out with a total. The Birth Death numbers influence the overall totals but the math is not as simple as it appears and the effect is nowhere near as big as it might logically appear at first glance.
The BLS added massive numbers of jobs every month to its model, all through the recession. Those jobs never existed. Last month the BLS made those revisions to job totals to reflect errors in its Birth/Death model.
BLS Black Box
For those unfamiliar with the birth/death model, monthly jobs adjustments are made by the BLS based on economic assumptions about the birth and death of businesses (not individuals).
Birth/Death assumptions are supposedly made according to estimates of where the BLS thinks we are in the economic cycle. Theory is one thing practice is clearly another.
Household Data
The number of unemployed persons was 15.0 million in May. The unemployment rate edged down to 9.7 percent, the same rate as in the first 3 months of 2010.
The number of long-term unemployed (those jobless for 27 weeks and over) was about unchanged at 6.8 million. These individuals made up 46.0 percent of unemployed persons, about the same as in April.
The number of unemployed reentrants to the labor force fell by 286,000 in May, offsetting an increase in April.
The civilian labor force participation rate edged down by 0.2 percentage point to 65.0 percent.
The number of persons employed part time for economic reasons (sometimes referred to as involuntary part-time workers) declined by 343,000 in May to 8.8 million. These individuals were working part time because their hours had been cut back or because they were unable to find a full-time job.
[Mish Note: In January the number was 8.3 million]
Persons Not in the Labor Force
About 2.2 million persons were marginally attached to the labor force in May, unchanged from a year earlier. These individuals were not in the labor force, wanted and were available for work, and had looked for a job sometime in the prior 12 months. They were not counted as unemployed because they had not searched for work in the 4 weeks preceding the survey.
Table A-8 Part Time Status
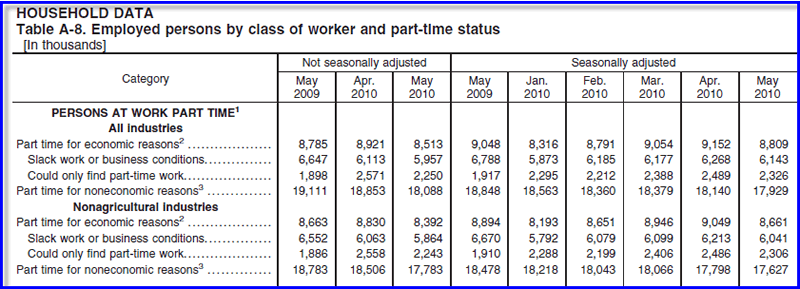
The key take-away is there are 8,809,00 of workers whose hours may rise before those companies start hiring more workers.
Table A-15
Table A-15 is where one can find a better approximation of what the unemployment rate really is.
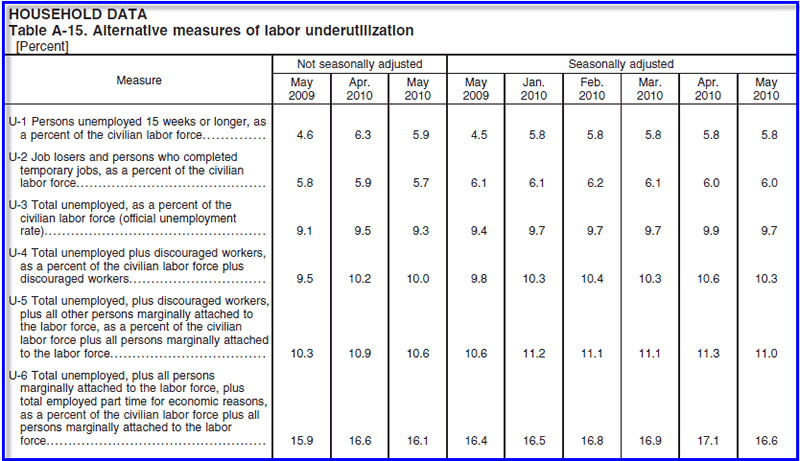
Grim Statistics
The official unemployment rate is 9.7%. However, if you start counting all the people that want a job but gave up, all the people with part-time jobs that want a full-time job, all the people who dropped off the unemployment rolls because their unemployment benefits ran out, etc., you get a closer picture of what the unemployment rate is. That number is in the last row labeled U-6.
It reflects how unemployment feels to the average Joe on the street. U-6 is 16.6%.
Looking ahead, there is no driver for jobs. Moreover, states are in forced cutback mode on account of shrinking revenues and unfunded pension obligations. Shrinking government jobs and benefits at the state and local level is a much needed adjustment. Those cutbacks will weigh on employment and consumer spending for quite some time.
Expect to see structurally high unemployment for years to come.
Keep in mind that huge cuts in public sector jobs and benefits at the city, county, and state level are on the way. These are badly needed adjustments. However, the union parasites will not see it that way, nor will the politicians.
All things considered, this report looks anemic on the surface and even worse with a close inspection of the details.
By Mike "Mish" Shedlock
http://globaleconomicanalysis.blogspot.com
Click Here To Scroll Thru My Recent Post List
Mike Shedlock / Mish is a registered investment advisor representative for SitkaPacific Capital Management . Sitka Pacific is an asset management firm whose goal is strong performance and low volatility, regardless of market direction.
Visit Sitka Pacific's Account Management Page to learn more about wealth management and capital preservation strategies of Sitka Pacific.
I do weekly podcasts every Thursday on HoweStreet and a brief 7 minute segment on Saturday on CKNW AM 980 in Vancouver.
When not writing about stocks or the economy I spends a great deal of time on photography and in the garden. I have over 80 magazine and book cover credits. Some of my Wisconsin and gardening images can be seen at MichaelShedlock.com .
© 2010 Mike Shedlock, All Rights Reserved.
© 2005-2022 http://www.MarketOracle.co.uk - The Market Oracle is a FREE Daily Financial Markets Analysis & Forecasting online publication.