India, Australia, Canda GDP Trends and Monetary Policy Update
Economics / Global Economy Jun 07, 2010 - 09:05 AM GMTBy: EconGrapher
 This week we look at the surging growth in the Indian economy, continued improvement in the GDP results from Australia, a strengthening recovery in the Canadian economy, and monetary policy decisions by Australia and Canada, and finish up with a look at the US nonfarm payroll figures which showed strong census hiring and not much else.
The main theme is global growth is being lead by emerging markets, with a select few developed economies in close pursuit, while other developed economies continue to dawdle as the gradual fragile global economic recovery continues.
1. India GDP
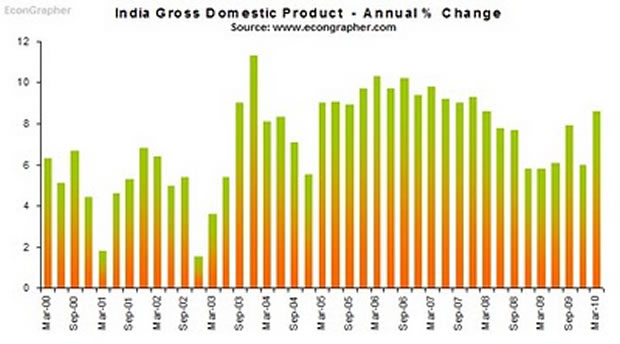
India's economy grew 8.6% year on year in the first quarter of this year, cementing a trend of strong economic growth in emerging markets. The figure compares to 6.5% in Q4 2009, and was slightly below consensus 8.8%. The figure puts India on a similar path to it's neighbour and fellow economy, China, and places it in a similar predicament on the monetary policy front, with India having already increased its interest rate 25bps in April. In terms of the outlook, the Indian economy seems to be relatively strong at this point, echoing the trends of the other big emerging markets like China, Brazil, Indonesia, etc. The IMF noted in its World economic outlook that it expects the Indian economy to grow 8.8% in 2010 and 8.4% in 2011.
2. Australia GDP
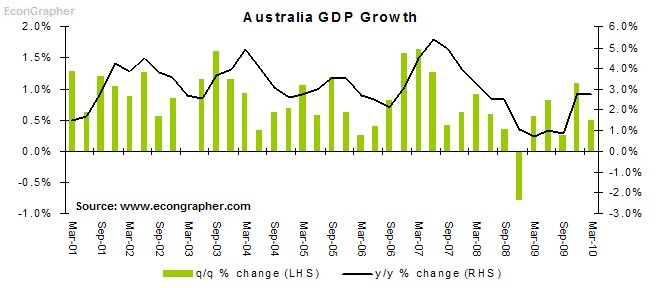
The Australian economy grew 0.5% in Q1 this year, slightly slower than the previous quarter's 1.1%, but up to 2.7% on an annual basis. The main contributors to growth were public gross fixed capital formation and household final consumption expenditure. The Australian economy continues to benefit from the effects of the stimulus spending and commodity price recovery. Indeed the RBA noted in its policy statement; "In Australia, with the high level of the terms of trade expected to add to incomes and demand, output growth over the year ahead is likely to be about trend, even though the effects of earlier expansionary policy measures will be diminishing. Inflation appears likely to be in the upper half of the target zone over the next year."
3. Canada GDP
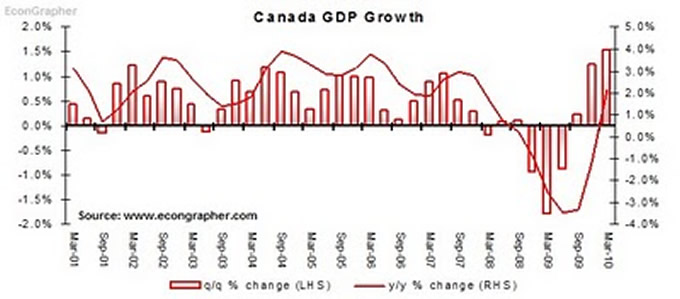
The Canadian economy grew 1.5% quarter on quarter in Q1 2010, slightly under consensus but accelerating the pace of recovery. Unlike the other G7 economies, Canada benefits more from rising commodity prices and compared to the rest; a stronger fiscal position. Similar to the Australians, the Bank of Canada said this week: "Activity in Canada is unfolding largely as expected. The economy grew by a robust 6.1 per cent in the first quarter, led by housing and consumer spending. Employment growth has resumed. Going forward, household spending is expected to decelerate to a pace more consistent with income growth. The anticipated pickup in business investment will be important for a more balanced recovery."
4. Monetary Policy Update
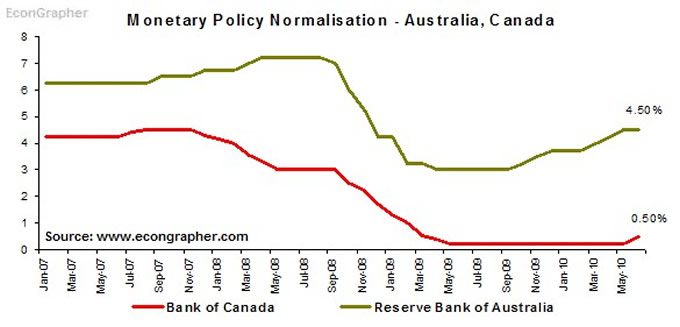
The trend for global monetary policy normalisation or neutralisation continued in the "select few developed economies". The Reserve Bank of Australia left its cash rate unchanged at 4.50%, suggesting the rate is near neutral, but leaving the door open for further increases. Meanwhile Canada became the first G7 economy to lift interest rates, increasing the overnight rate by 25bps to 0.50%, leaving it at a still considerably stimulatory level, but commencing the return to normality. Expectations are for the overnight rate in Canada to end up around 1.5% by the end of the year (of course this is contingent on things elsewhere remaining calm and the domestic recovery continuing).
5. US Nonfarm Payrolls
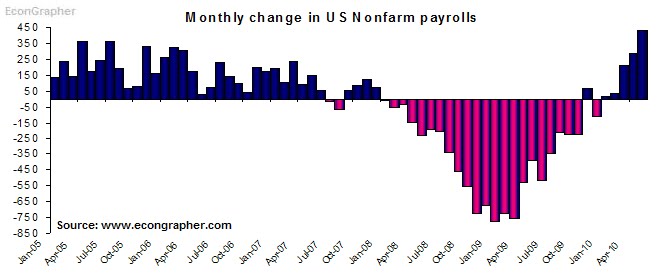
US nonfarm payrolls increased 430k in May, accelerating from 290k in April, but below consensus 540k. The relatively strong number was driven by census hiring, with temporary census jobs adding 411k temp jobs, leaving a pretty small portion to the private sector part of the growth. Among private sector jobs, manufacturing and temporary help services contributed the most. The census hiring will probably provide some much needed stimulus to consumer spending, but overall the underlying trends in the labour market are lukewarm. The PMI figures released earlier this week showed that employers were net expecting to hire (but not by a huge margin). So it fits in with the theme of a gradual, fragile and sub-trend recovery in the US.
Summary
So to sum up we have the Indian economy growing strongly, even presenting inflationary risks, and solidifying the thesis of emerging market economies driving much of global growth and the recovery. Then we saw GDP growth still chugging along in Australia thanks to a strong terms of trade and residual stimulus effects. In Canada the economy showed further signs of strengthening, even spurring the Bank of Canada to raise rates this week. Meanwhile in the US, a strong payrolls figure was driven by temporary census hiring, and signaling a sluggish real labour market, and potential challenges for the US economy.
So the message is; emerging market economies are leading the recovery, a select few developed economies are in close pursuit, while others are dawdling. The obvious second order effect is a fragile pick-up in global activity with risks that some of the developed economies hold back the rest e.g. certain European economies). And as the recovery continues, stimulus exits and policy normalisation will proceed in places where it is possible, and in some cases increasingly necessary.
Sources:
1. OECD Statistics stats.oecd.org
2. Australian Bureau of Statistics www.abs.gov.au
3. Trading Economics www.tradingeconomics.com
4. Reserve Bank of Australia www.rba.gov.au & Bank of Canada www.bankofcanada.ca
5. US Bureau of Labour Statistics www.bls.gov
Article source: http://www.econgrapher.com/top5graphs5june.html
By Econ Grapher
Bio: Econ Grapher is all about innovative and insightful analysis of economic and financial market data. The author has previously worked in investment management, capital markets, and corporate strategy.
Website: http://www.econgrapher.com
Blog: http://econgrapher.blogspot.com
© 2010 Copyright Dhaval Shah - All Rights Reserved
Disclaimer: The above is a matter of opinion provided for general information purposes only and is not intended as investment advice. Information and analysis above are derived from sources and utilising methods believed to be reliable, but we cannot accept responsibility for any losses you may incur as a result of this analysis. Individuals should consult with their personal financial advisors.
© 2005-2022 http://www.MarketOracle.co.uk - The Market Oracle is a FREE Daily Financial Markets Analysis & Forecasting online publication.


