


Stock Market and Bond Markets Better Than 2008, Is Not The Same As Good
Stock-Markets / Stock Markets 2010 Jun 08, 2010 - 08:40 AM GMTBy: Richard_Shaw

 Sure, things are not as bad in the stock and bond markets as they were in the depths of 2008 and 2009, but better isn't the same thing as good. The "worry list" in the marco-environment is too long and too severe to think of today as "normal" (unless you are talking about the PIMCO "new normal"), and there are price behavior signs that all is not well.
Yesterday, we wrote about the S&P 500 being under its 200-day average for 11 straight days -- a bearish thing. The day before that, we wrote about the sub-normal fundamentals for the S&P 500 along with above normal valuation -- not an engine for multiple expansion.
Today, we note that the VIX, while well below its 2008 highs, is way above average, and at levels only seen at other times of great stress.
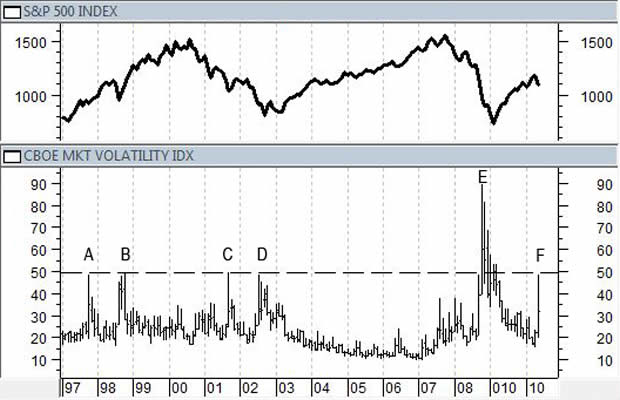
The dashed horizontal line in the chart above shows today's VIX (30-day option implied volatility for the S&P 500) at "F". Let's consider the other times VIX was that high, at points "A", "B", "C", and "D".
A ) the October 1997 "mini-crash" associated with the Asian currency crisis
B) the August 1998 Russian currency and debt crisis
C) the 9/11 Islamic Terrorist attack on New York City
D) the cathartic bottoming of the multi-year market decline
Given all that is on the "worry list", we have a hard time thinking that "F" (today) is a cathartic correction, but it could be.
More likely, we think, that all is not well and that fragile improvements since 2008 are severely at risk.
We think safe is better than sorry for the moment. Our clients have completed the asset accumulation stage of life for the most part and cannot replace losses -- so we err of the side of caution when in doubt. We are in cash and bonds for now.
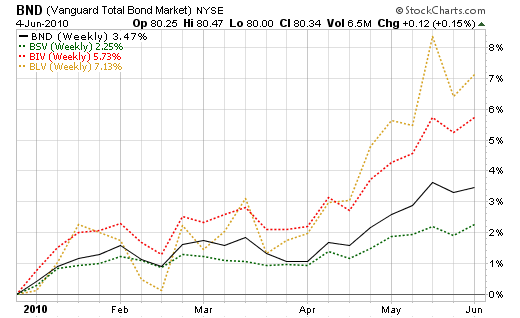
While we think bonds will have their own troubles -- municipals in particular -- they are OK for now. In fact, the superior performance of longer maturity bonds over shorter maturity bonds is a reversal of sentiment -- suggesting once again more deflation fear than inflation fear. It's hard to believe that all that currency expansion won't someday create inflation. The market it betting otherwise for now, as this chart of short-term (BSV), intermediate-term (BIV) and long-term (BLV) bonds versus aggregate bonds (BND) shows.
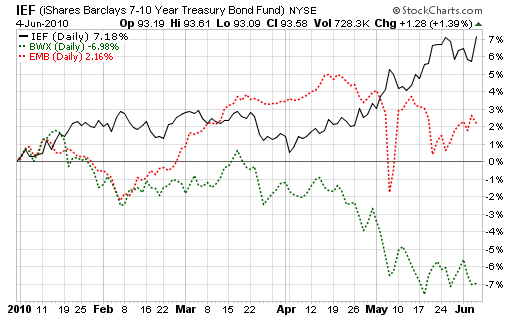
It may not be that bonds are so wonderful, but that US bonds are less terrible than non-US bonds, as this chart of intermediate-term US (IEF), local currency non-US developed country (BWX), and USD denominated emerging market (EMB) sovereign debt shows.
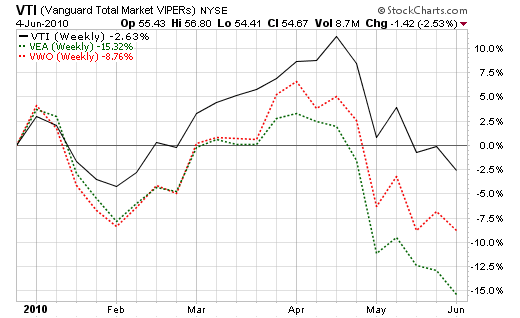
However, if things are so bad elsewhere, and knowing that below the surface things aren't so great here, how can the US stock market surge? Consider this chart of the US stock market (VTI), developed non-US markets, excluding Canada (VEA), and emerging markets (VWO).
The high yield (VWEHX, similar to HYG and JNK) [shown in red] versus investment grade bond (VFICX,, similar to LQD) [shown in blue] relationship also suggests a likely negative short-term future for the US stock market, as the following chart shows.
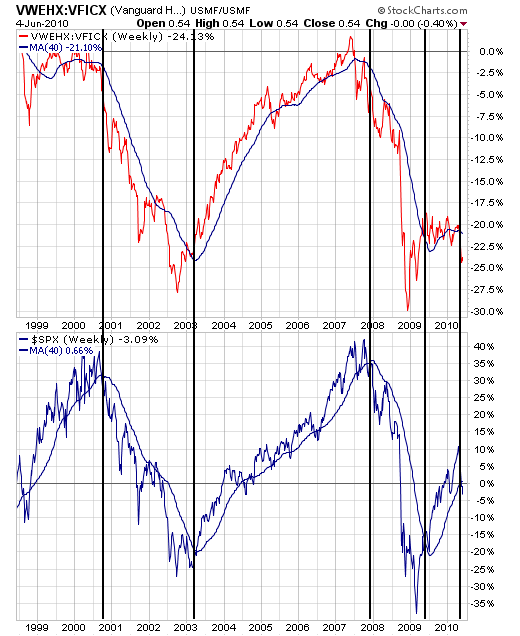
This "inter-market" chart, shows how the bond market is confirming the stock market. High yield bonds go down in price faster than investment grade bonds when economic conditions deteriorate, and rise faster than investment grade bonds when economic conditions improve. With the bond ratio below its 200-day average at the same time the S&P 500 is below its 200-day average, negative implications are stronger than positive implications.
Some of the key "worry list" items are:
•PHIGS (Portugal, Hungary, Ireland, Greece and Spain) sovereign debt quality
•memory of Iceland and Dubai
•North Korea sinking a South Korean naval vessel
•Iran ignoring call to stop moving to nuclear bombs
•Israel between rock and hard place with Hamas/Iran and Western criticism
•enormous economic impact of massive Gulf oil spill
•BP financial/political disaster
•Ban on Gulf drilling (oil supply and cost implications)
•Euro/Dollar making US exporters less competitive
•China real estate bubble ready to burst
•Slow down in China raw materials purchases (commodity price declines)
•Uncertain US Congressional control in 5 months
•Concern over what will be the next over-reaching US government intervention
•Pending general US tax increases in 2011 (7 months)
•Pending investment income tax increases (dividends and healthcare tax)
•Massive budget problems in States with muni bond consequences
•Questions about continued tax exemption for muni bonds for upper income investors
•Questions about Build America Bonds diminishing supply of tax-exempt bonds
•Questions about Federal control of more state matters through Build America Bonds
•Economic consequences of potential amnesty for illegal aliens.
Current Equity Positions and Next Indication:
When the price of securities is above their 200-day average, we'll give them another look, but before that time we wait. There is, of course, more to consider than just the price versus the 200-day average. However, in these times for us the price above that level is the minimum threshold to justify further consideration.
We exited equities in mid-2008, re-entered equities in mid-2009, and are out of equities at this time.
2010 feels a lot better than 2008, but better ain't the same as feeling good.
Holdings Disclosure: As of June 5, 2010, we do not own any securities mentioned in this article in any managed accounts.
By Richard Shaw http://www.qvmgroup.com
Richard Shaw leads the QVM team as President of QVM Group. Richard has extensive investment industry experience including serving on the board of directors of two large investment management companies, including Aberdeen Asset Management (listed London Stock Exchange) and as a charter investor and director of Lending Tree ( download short professional profile ). He provides portfolio design and management services to individual and corporate clients. He also edits the QVM investment blog. His writings are generally republished by SeekingAlpha and Reuters and are linked to sites such as Kiplinger and Yahoo Finance and other sites. He is a 1970 graduate of Dartmouth College.
Copyright 2006-2010 by QVM Group LLC All rights reserved.
Disclaimer: The above is a matter of opinion and is not intended as investment advice. Information and analysis above are derived from sources and utilizing methods believed reliable, but we cannot accept responsibility for any trading losses you may incur as a result of this analysis. Do your own due diligence.
Richard Shaw Archive |
© 2005-2022 http://www.MarketOracle.co.uk - The Market Oracle is a FREE Daily Financial Markets Analysis & Forecasting online publication.