


Stock Markets Risk Reward Analysis From Current Levels
Stock-Markets / Stock Markets 2010 Jun 10, 2010 - 12:15 PM GMTBy: Chris_Ciovacco

 While it may feel like we have entered a new bear market and that nothing like this has happened before, history paints a different picture. Markets move primarily based on greed and fear. The human emotions of greed and fear are the same today as they were in the 1980s (and as they were in the 1950s or any other period you choose to examine). This tells us if it happened before, it can happen again.
The table below shows bull market corrections of similar magnitude that have taken place in recent history. The period (1989-2010) contains two of the worst bear markets in history (2000-2003, 2007-2009), so the argument that things were never as bad economically (1989-2010) as they are today does not hold water - they have been just as bad or worse. Therefore, models that say today looks more like a correction (thus far) than a new bear market, have two excellent examples of bear markets to reference. Just as it does today, it also felt like the world was going to end in the periods shown below. The stock market does not drop 10%-plus without some bad economic news, real fundamental concerns, high levels of fear, and low levels of confidence about the future. We are fooling ourselves if we think it was stress-free and all laughs during the corrections shown below. Corrections are never easy – 2010 is no different.
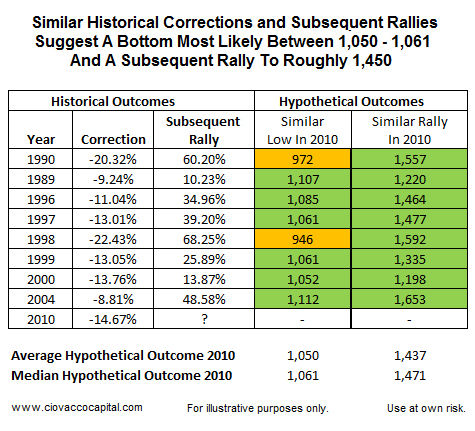
The hypothetical portion of the table above shows possible market lows and subsequent market highs using past patterns of human greed and human fear. The average projected low based on the historical examples above would arrive near 1,050 on the S&P 500. The bad news is if 2010 is more similar to 1990 or 1998, then the low would not come in until somewhere near 972, or 946. Since we deal in probabilities, a break of 946 on the S&P 500 would increase the chances the current decline is the early stages of a longer-term bear market. The purpose of this analysis is to better understand outcomes that fall within normal correction ranges and outcome that may point to something more serious. Additional market weakness and violations of the important levels discussed here will increase the odds of a new bear market. It is important that we keep an open mind about both bullish and bearish outcomes as the evidence evolves over time.
For numerous reasons, the odds continue to favor the continuation of the bull market rather than the onset of a new bear market: (a) current stage of economic cycle, (b) economic indicators, (c) health of stock market prior to recent declines, (d) current health of stock market relative to past corrections, (e) monetary policy, (f) need to inflate asset prices, (g) recent earnings growth, etc. The present day looks more like a correction than the beginning of the 2000 and 2007 bear markets. We absolutely and positively may be entering a new bear market in 2010, but the odds, based on the information in hand, say the bearish outcome is a lower probability when compared to the higher probability outcome of this being a correction within a bull market.
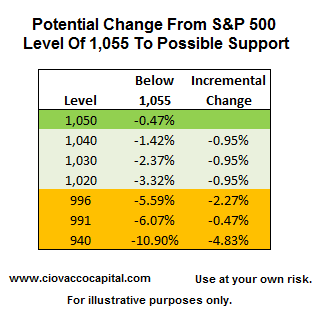
Since markets have been dropping in a nerve-racking manner in recent weeks, it is a good idea to get a handle on where the declines may logically be met with some buyers. The table below shows the additional downside risk should the S&P 500 drop from 1,055 to various levels.
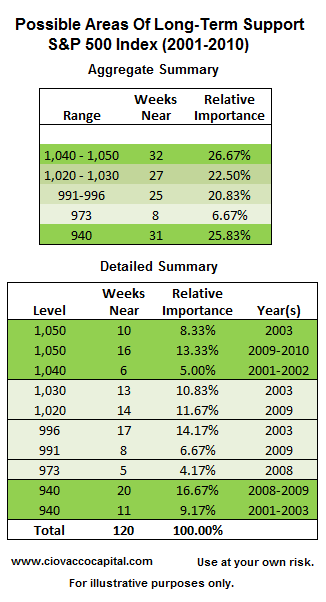
Support levels refer to areas where greed and fear have tended to offset each other for a time. As a result, prices have tended to congregate in areas when neither buyers nor sellers have full control of the market. We studied past areas of price clustering or congregation to get a better understanding of where the current declines might find a better balance between the desire to sell and the desire to buy. In theory, the longer prices cluster in a relatively narrow range, the more relevant the area becomes in terms possibly of impacting future prices. As shown in the tables below, prices have clustered in five basic areas or ranges between 1,050 and 940. The longest period associated with the ranges or areas shown below was 32 weeks (between 1,040 and 1,050). In theory, this means 1,040-1,050 may offer stronger support relative to the other areas.
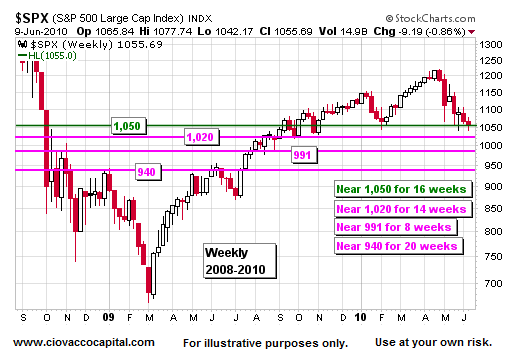
The study of historical corrections and possible areas of past price support help us make better decisions related to balancing the desire to remain invested to capture possible gains in a subsequent rally with the need to protect principal in the event a new bear market has already started. The weekly charts of the S&P 500, shown below, help us identify areas of possible support. The 2009-2010 chart is the most relevant since markets tend to focus on shorter-term events (most market participants use daily charts and infrequently perform detailed studies of history).
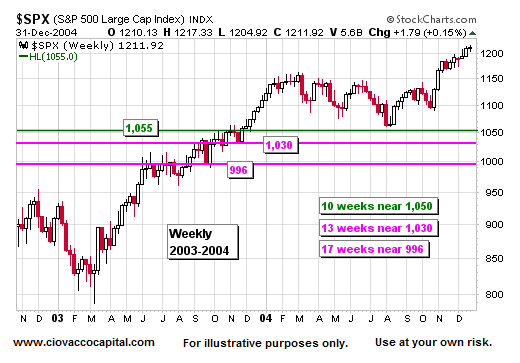
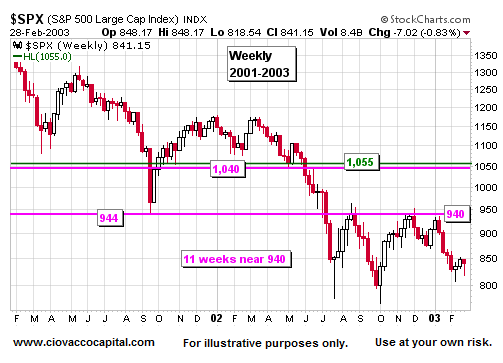
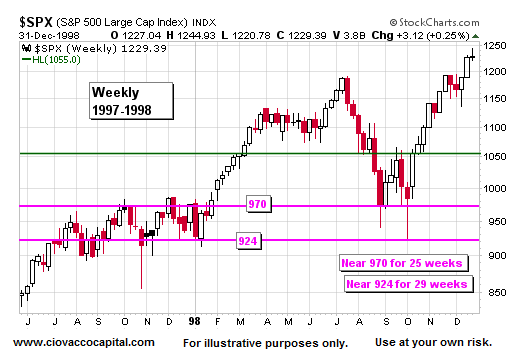
The takeaway here for us is S&P 500 violations of 1,050 and 1,040 on a closing basis, would increase the need to consider defensive measures. Violations of 972 and 946 would increase the odds of a more lasting decline in the form of a bear market. The levels shown in the charts and tables above reflect general areas rather than specific levels.
A short-term violation of important levels may not be cause for alarm. The longer general levels are breached, the more relevant it becomes. A weekly close below an important level makes it much more relevant that an intraday or intraweek low.
Our historical market models remain bullish longer-term, which means we will err on the side of staying with the bull market. However, it is important to have a detailed exit strategy in place in the event recent declines evolve into a more serious and lasting bear market. The information above can help with possible exit strategies should they be needed.
Additional comments can be found in Short Takes.
By Chris Ciovacco
Ciovacco Capital Management
Copyright (C) 2009 Ciovacco Capital Management, LLC All Rights Reserved.
Chris Ciovacco is the Chief Investment Officer for Ciovacco Capital Management, LLC. More on the web at www.ciovaccocapital.com
Ciovacco Capital Management, LLC is an independent money management firm based in Atlanta, Georgia. As a registered investment advisor, CCM helps individual investors, large & small; achieve improved investment results via independent research and globally diversified investment portfolios. Since we are a fee-based firm, our only objective is to help you protect and grow your assets. Our long-term, theme-oriented, buy-and-hold approach allows for portfolio rebalancing from time to time to adjust to new opportunities or changing market conditions. When looking at money managers in Atlanta, take a hard look at CCM.
All material presented herein is believed to be reliable but we cannot attest to its accuracy. Investment recommendations may change and readers are urged to check with their investment counselors and tax advisors before making any investment decisions. Opinions expressed in these reports may change without prior notice. This memorandum is based on information available to the public. No representation is made that it is accurate or complete. This memorandum is not an offer to buy or sell or a solicitation of an offer to buy or sell the securities mentioned. The investments discussed or recommended in this report may be unsuitable for investors depending on their specific investment objectives and financial position. Past performance is not necessarily a guide to future performance. The price or value of the investments to which this report relates, either directly or indirectly, may fall or rise against the interest of investors. All prices and yields contained in this report are subject to change without notice. This information is based on hypothetical assumptions and is intended for illustrative purposes only. THERE ARE NO WARRANTIES, EXPRESSED OR IMPLIED, AS TO ACCURACY, COMPLETENESS, OR RESULTS OBTAINED FROM ANY INFORMATION CONTAINED IN THIS ARTICLE. PAST PERFORMANCE DOES NOT GUARANTEE FUTURE RESULTS.
Chris Ciovacco Archive |
© 2005-2022 http://www.MarketOracle.co.uk - The Market Oracle is a FREE Daily Financial Markets Analysis & Forecasting online publication.
Comments
|
Ajay
11 Jun 10, 00:21 |
Risk Reward Analysis
Excellent article Chris. Would have liked to see consideration of any break below 944. Great work. Thanks, Ajay |