


Stocks and Commodities Downtrend Could Have Ended, A Colorful View on SPX, Gold & Oil
Stock-Markets / Financial Markets 2010 Jun 17, 2010 - 02:02 AM GMTBy: Chris_Vermeulen

 It’s been a bright week so far for stocks and commodities. It appears that the down trend could have ended as of yesterday (Tuesday June 15th). In this mid-week report I figured I would bring back the 80’s colors to see if I can spice things up!
Below are some charts I did showing my current views on the market. You may want to put on your hyper color shirt, sunglasses and zinc when viewing them in order to get into the zone… lol
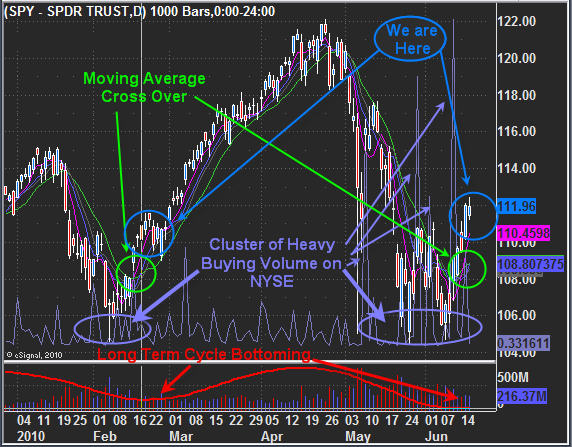
SPX – S&P500 Index Exchange Traded Fund – Daily Chart
I’ll keep this short and sweet here are the main points.
Moving Averages crossed over this week and when we see this a trend reversal generally occurs. That being said it is best to wait for the moving averages to cluster which means we need a pullback or sideways movement for a few days. I feel this is very likely to happen.
NYSE Buying Spikes have returned! We saw these during the previous bottom back in February. As the market continues to trend higher and mature these volume spikes tend to increase also.
Long Term Cycle has bottomed and should start to rise this week. As we can see from the February bottom the cycle was also bottoming which is very bullish for the index.
We Are Here shows where I think we are currently trading. The market is over bought right now and I feel a quick pullback or sideways move is needed before we see a continued move up.
Here is my Pre-Market Trading Video & Squawk Box Recording for today if you want to see my charts as of this morning: http://www.futurestradingsignals.com/..
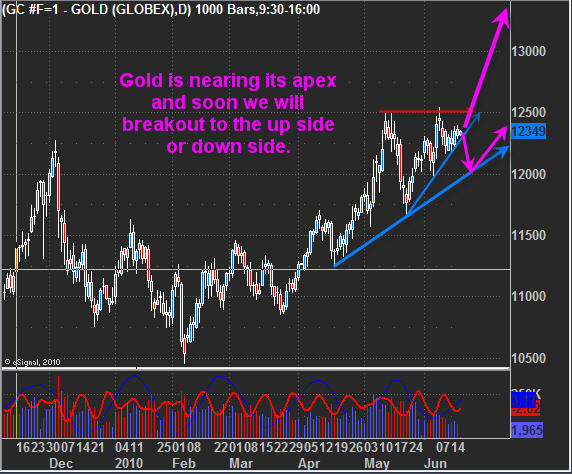
Gold Futures – Daily Chart
Gold is trading in a tight wedge at the moment. The long term picture is pointing to higher prices but I feel there is a good change of one last drop which should shake out a bunch of traders before rocketing upwards. August and September are good months for gold to move up and if you have been following the market as long as I have then you know patterns and prices can drag out much longer than we anticipate. So as much as the chart of gold looks like an imminent breakout is about to occur, it could still be a few months way. And to be honest that’s how the market works…. If it doesn’t shake you out, it will wear you out!
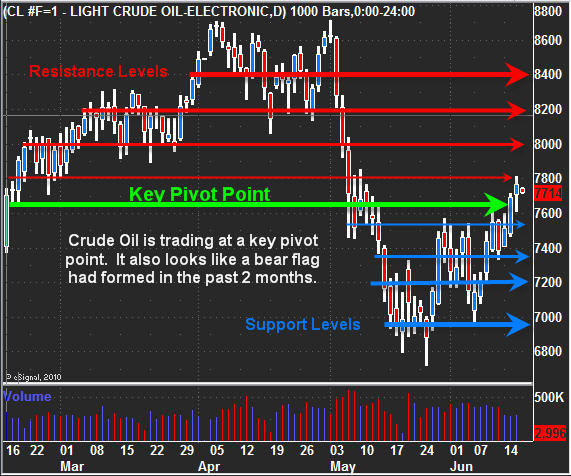
Crude Oil Futures – Daily Chart
Oil is trading a key pivot point and also looks to have formed a possible bear flag. At the moment I am neutral on oil, it’s a 50/50 guess as to which way it will go, so I am just watching for now… But I have pointed out some key resistance and support levels for those with oil positions… This small chart makes it look like I put a ling at ever $2 but if you look closer some are above and below those even numbers.
Mid-Week Stock and Commodity Wrap Up:
In short, I think the market is on the verge of another rally which is very exciting since we cashed out in late April before the market had the big sell off. It will be nice to put some long term plays to work so we are not so dependent on the short intraday plays which last 1-2 days because of the extreme volatility in the market.
I figure we will see stocks and gold move up together but I’m not really sure about oil at this point… If oil does not move up then the market will have limited up side and instead of a new bull market rally to new 2010 highs we could just see move up to test near the April high. Then it could roll over and start heading back down triggering much larger sell off as we enter another bear market.
All that being said… it looks to be a couple months away still and a lot can happen in that time. As a market technician I take each chart one day at a time.
If you would like to receive my Real-Time Trading Signals & Trading Education check out my website at www.FuturesTradingSignals.com
By Chris Vermeulen
Chris@TheGoldAndOilGuy.com
Please visit my website for more information. http://www.TheGoldAndOilGuy.com
Chris Vermeulen is Founder of the popular trading site TheGoldAndOilGuy.com. There he shares his highly successful, low-risk trading method. For 6 years Chris has been a leader in teaching others to skillfully trade in gold, oil, and silver in both bull and bear markets. Subscribers to his service depend on Chris' uniquely consistent investment opportunities that carry exceptionally low risk and high return.
This article is intended solely for information purposes. The opinions are those of the author only. Please conduct further research and consult your financial advisor before making any investment/trading decision. No responsibility can be accepted for losses that may result as a consequence of trading on the basis of this analysis.
Chris Vermeulen Archive |
© 2005-2022 http://www.MarketOracle.co.uk - The Market Oracle is a FREE Daily Financial Markets Analysis & Forecasting online publication.