UK House Prices Inflation Adjusted Long-term Trend Analysis
Housing-Market / UK Housing Jun 17, 2010 - 08:00 AM GMTBy: Nadeem_Walayat
 Inflation has huge a impact on the trend for nominal house prices over the long term and therefore forms an important factor in determining a multi-year house price trend forecast.
This analysis is part of a series that will culminate in a multi-year UK house prices trend forecast that will seek to more than replicate the original 2 year bear market forecast of August 2007 made right at the very peak of the UK housing market (22 Aug 2007 - UK Housing Market Crash of 2007 - 2008 and Steps to Protect Your Wealth ), which also builds up on the 100 page Inflation Mega-Trend Ebook of Jan 2010 (Free Download Now), which contained the following UK housing market analysis (updated graph):
UK Housing Bear Market Election Bounce
The UK housing market peaked in August 2007 and entered into a 2 year bear market exactly as forecast at the time (22 Aug 2007 - UK Housing Market Crash of 2007 - 2008 and Steps to Protect Your Wealth ), analysis which projected towards a fall in UK house prices from August 2007 to August 2009 of between 15% and 25% that has subsequently came to pass as UK house prices bottomed in March 2009 after having fallen by 23% from the 2007 peak.
The UK housing bear market has experienced a strong bounce off of the March 2009 lows and now stands up approx 10% off of the low as a consequence of unprecedented measures as mentioned in this ebook, the Labour government has succeeded in temporarily bringing UK house price falls to a halt and triggering an Election Bounce.
The impact of the inflation mega-trend on the UK housing market will be for UK house price to be supported in nominal terms, however this it does NOT ignite the feel good factor that triggers housing market booms which only follow when house prices begin to significantly rise in REAL terms i.e. after inflation.
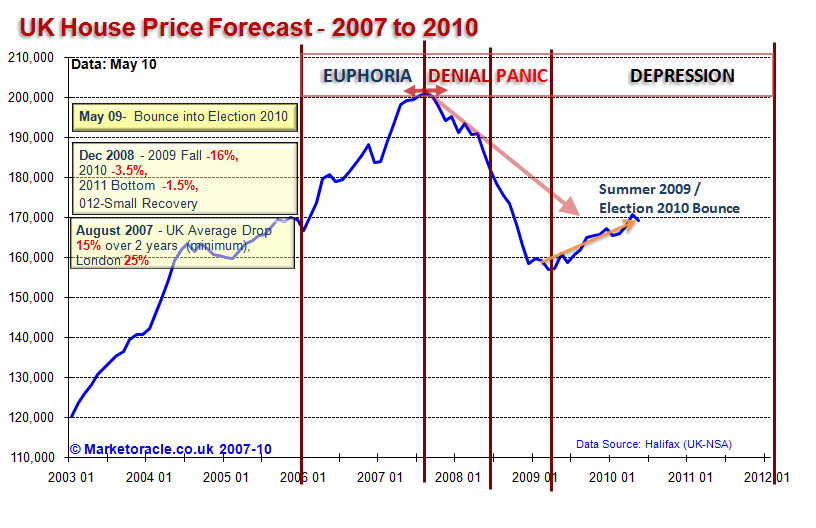
Whilst the current corrective bounce looks set continue into the middle of 2010 (allowing for a potential one month blip as a consequence of the bad January weather), this rally is still seen as a correction within a housing bear market that is expected to remain in a depression for many years, before house prices succumb to the effect of the inflation mega-trend and start to rise.
UK Inflation Trend Upward Pressure on Nominal House Prices
UK CPI Inflation at 3.4% for May 2010 is inline with to my trend forecast for 2010 as of December 2009 that projected May data of 3.1%. My analysis since November has been warning of a spike in UK inflation as part of an anticipated inflation mega-trend (18 Nov 2009 - Deflationists Are WRONG, Prepare for the INFLATION Mega-Trend ) that culminated in the forecast of 27th December 2009 (UK CPI Inflation Forecast 2010, Imminent and Sustained Spike Above 3%) and the Inflation Mega-trend Ebook of January 2010 (FREE DOWNLOAD) as illustrated by the below graph.
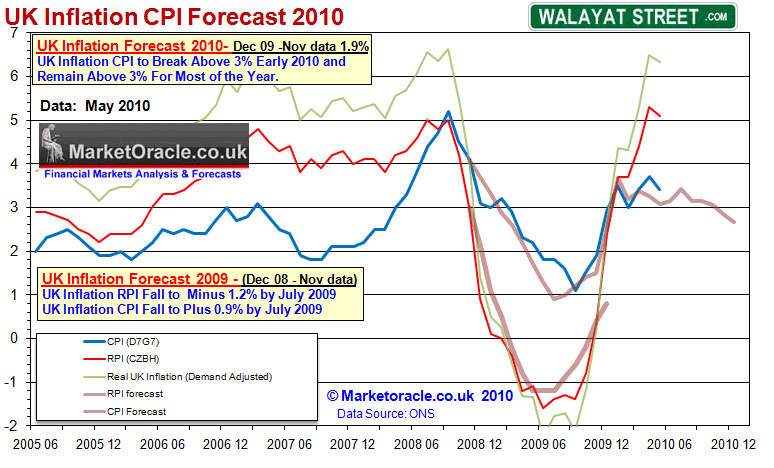
Whilst the current CPI inflation forecast is for 2010, I do expect the above inflation trend to continue in a range of between 2% and 4% for the next 3 years. However the economy and UK housing market is actually more sensitive to the RPI inflation measure that plays an important role in determining annual pay and benefit increases. In this regard the tendency for RPI is to over shoot to the upside to CPI which therefore implies upward inflationary pressure on nominal House Prices of between 10% to 14% over the next 3 years.
UK House Prices Inflation Adjusted Trend Implications
The UK having enjoyed the benefits of the wealth effect right upto the UK housing market peak of August 2007 when average UK house prices peaked at 201,081, following which house prices entered a severe housing bear market that bottomed in March 2009 as indicated by the below long-term house prices graph :
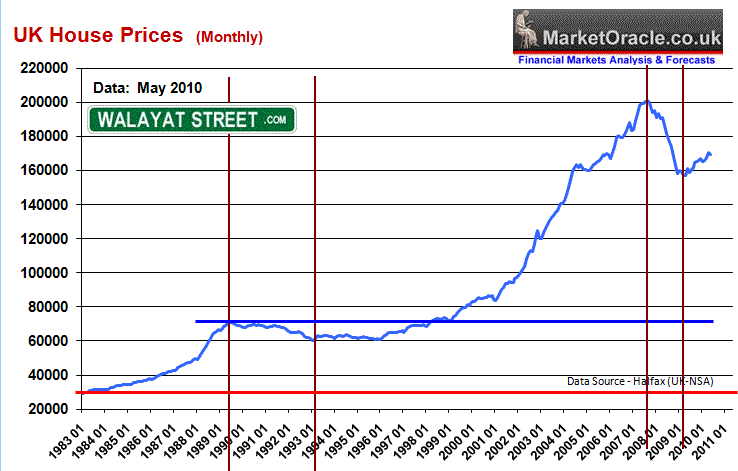
The subsequent debt fuelled Labour election recovery has seen average house prices rally by 10%. However the nominal house prices trend graph masks the actual impact on the consumer economy of the trend in real house prices after RPI inflation as illustrated below :
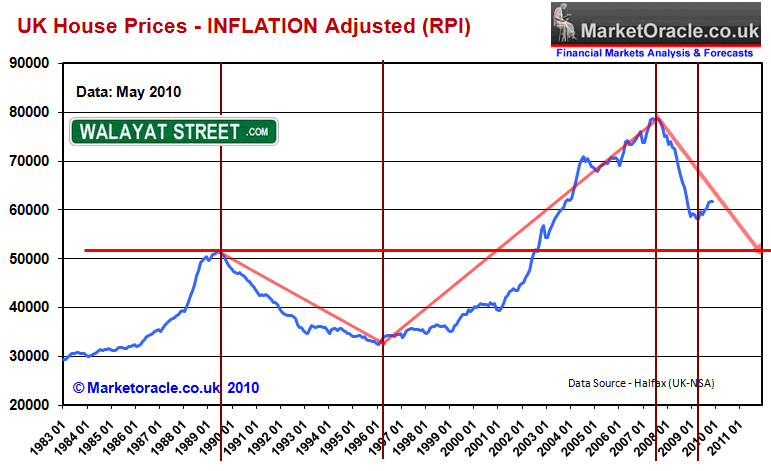
The real house price graph more significantly illustrates why the housing bust of the early 1990's contributed to the UK heading for recession and a loss of confidence in the housing market that subsequently persisted for over 5 years. This answers the question as to why people were reluctant to buy houses in the period 1993 to 1997 despite nominal house prices having stabilised and having started to rise, whilst in real terms house prices were still falling and in fact did not bottom until 1996 with the uptrend only being confirmed during the beginning of 1998. Therefore it is only when house prices stopped falling in real terms that the house price uptrend started to gain momentum and trigger the bull market. It took a further 4-5 years before house prices crossed the previous peak of 1989 some 13 years later when the UK housing market boom began.
The severe bear market from August 2007 and into March 2009 has bottomed in real terms. However with RPI inflation at 5.1% (May 2010), the actual uptrend in house prices has barely kept pace with inflation and still stands a long way from the last peak of August 2007.
The implications of the real trend in UK house prices are:
a. The housing market is nowhere near reaching another boom phase which only coincides when house prices pass their previous peak in REAL terms i.e. after inflation, this suggests that any upward trend in house prices is going to be shallow where the next boom could be as long as a decade away.
b. That the housing market in real terms has barely lifted off of its March low and is thus highly susceptible to a prolonged period of stagnation in real terms, i.e. the housing market basically goes nowhere for several years in real terms.
c. That it is highly likely that we have yet to see the low in UK house prices in real terms, which either means a sustained period of inflation or that the UK house prices revisit there 2009 March Bear market lows.
Conclusion
This analysis suggests that the value of UK house prices will continue to be eroded in real terms as a consequences of high inflation and weak nominal house prices trends which implies several years of stagnation to be followed by several more years of weak house prices growth in real terms. Thus those looking for a return to the boom times over the next few years are likely to be disappointed, especially the buy to let brigade that rely on capital appreciation in real terms to generate investment returns after costs.
Ensure you are subscribed to my always free newsletter to receive key analysis and forecasts in your email in box.
Comments and Source: http://www.marketoracle.co.uk/Article20377.html
By Nadeem Walayat
Copyright © 2005-10 Marketoracle.co.uk (Market Oracle Ltd). All rights reserved.
 Nadeem Walayat has over 20 years experience of trading derivatives, portfolio management and analysing the financial markets, including one of few who both anticipated and Beat the 1987 Crash. Nadeem's forward looking analysis specialises on UK inflation, economy, interest rates and the housing market and he is the author of the NEW Inflation Mega-Trend ebook that can be downloaded for Free. Nadeem is the Editor of The Market Oracle, a FREE Daily Financial Markets Analysis & Forecasting online publication. We present in-depth analysis from over 500 experienced analysts on a range of views of the probable direction of the financial markets. Thus enabling our readers to arrive at an informed opinion on future market direction. http://www.marketoracle.co.uk
Disclaimer: The above is a matter of opinion provided for general information purposes only and is not intended as investment advice. Information and analysis above are derived from sources and utilising methods believed to be reliable, but we cannot accept responsibility for any trading losses you may incur as a result of this analysis. Individuals should consult with their personal financial advisors before engaging in any trading activities.
Nadeem Walayat Archive |
© 2005-2022 http://www.MarketOracle.co.uk - The Market Oracle is a FREE Daily Financial Markets Analysis & Forecasting online publication.


