


Gold New All Time High Lacks Momentumn
Commodities / Gold and Silver 2010 Jun 19, 2010 - 03:33 PM GMTBy: Merv_Burak

 We’re into new all time highs in gold, inflation non-adjusted. Still the move does not have the momentum (strength) behind it to give us all that enthusiasm one might want to give to the move. Go with the flow but watch out should the flow stop.
GOLD : VERY LONG TERM
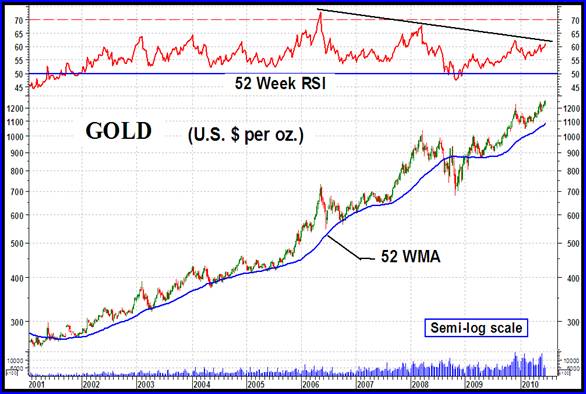
The chart today shows the gold move from a very long term perspective. It is a weekly chart with a 52 week (one year) simple moving average line and a momentum indicator from a very long term perspective (a 52 week RSI). It’s always instructive to go back and view the action from a very long term view to understand not so much what has happened but where we are in the very long term scheme of things.
Going forward we do have gold moving into new highs, we do have a positive sloping very long term moving average line and we do have a momentum indicator in its positive zone. So, from the standpoint of where we are everything still looks rosy.
Looking forward we do have signs of worry ahead. The momentum indicator has been continually showing a loss of strength on each successive move into new highs since reaching its peak in 2006. This latest gold move into new highs has not yet been confirmed by the momentum indicator. It remains below its level from the previous Dec high. The momentum cannot keep losing strength on each move. At some point it must either start to improve by moving above previous peaks or the strength of the moves will go negative.
The other indicator that is not all that positive is the daily (or weekly) volume action. The daily volume going into this week’s high prices is considerably below the volume that moved gold into its highs in mid-May or into its previous highs last Dec. Moving into new high territory with decreasing volume activity is never a bullish sign. Of course I am often told that there is “seasonality” with gold action or that there are commodity “expiration” dates that affect the volume activity but I have not found either explanation consistent. And besides, these are more in the fundamental discipline trying to explain the “WHY”; I am more concerned with the “WHAT”, as in what is happening not why something has happened.
One would not act on the implications of these very long term indicators but one would keep them in mind while reading the shorter term ones and deciding if the risks of investing or speculating are worth getting in or out of the market. Before these very long term indicators actually go fully bearish I would expect that the normal long and intermediate term indicators had already gone bearish long before.
Just as an aside, I would not be surprised if the momentum indicator should exceed its peak from last Dec, but that was a minor peak. The one to watch would be the previous major peak from early 2008. I would be very surprised if the momentum indicator got anywhere close to that level this time around.
LONG TERM
The long term P&F chart just keeps acting bullish. As mentioned last week, a move to $1260 would give us the next projection to $1320. That’s not much of a projected move. From the 14 May 2010 commentary I had further projections to $1470 and then to my projection from years ago, to the $1600 level. Although I also mentioned a $2575 projection one should not worry about that one. Just focus on the shorter term ones and upgrade your thinking as each projection is met. All of the projections are based upon my point and figure chart and the horizontal or vertical count methods. Both methods have been shown over the past seventy years or so to be quite accurate although no method is perfect and there will always be individual disappointments.
Looking at the normal long term indicators everything continues to be positive. Gold remains above its positive sloping moving average line and the momentum indicator continues in its positive zone above its positive sloping trigger line. Unfortunately, as with the very long term indicator this one is also giving us a warning that the momentum of the move is decreasing. The indicator is still below its level from the mid-May peak although the price is above its peak. As for the volume indicator, it too is below its level from the mid-May peak but is above its positive sloping trigger line. All in all, the long term rating remains BULLISH but with a few warning signs starting to enter the picture.
INTERMEDIATE TERM
For the intermediate term there is still no need to be concerned. Gold remains above its positive moving average line and the momentum indicator remains in its positive zone above a positive trigger line. As with the long term the intermediate term momentum indicator is still below its level from the mid-May peak and not confirming the price move to new highs. The volume indicator remains just above its positive sloping trigger line although the track of the indicator is more in the lateral rather than the upward path. The intermediate term remains BULLISH but as with the long term, with some warning signs entering the picture.
SHORT TERM
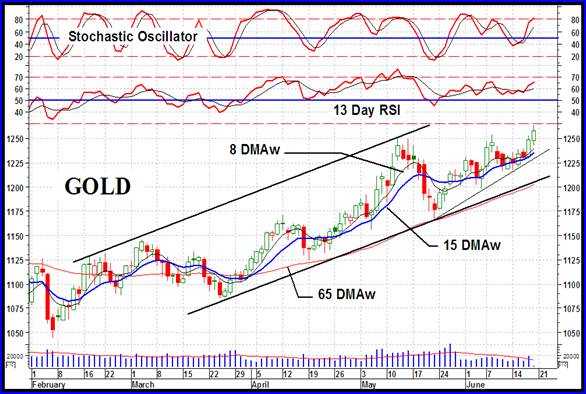
Here you see gold moving into new highs on Friday while the short term momentum indicator is still below its level from the May peak. I would expect that a few more upside days and the indicator will climb into its overbought zone, either above the May peak or pretty close, before a reaction sets in, but let’s wait for it.
The short term trend is still positive with gold above its positive moving average line. The momentum indicator remains in its positive zone above its positive trigger line. As mentioned, it is still below its May peak so is showing some loss of strength on this move. The daily volume activity remains pretty low for a bullish price move. If the move was REALLY that great then one would expect the speculators to be jumping in and increasing the daily volume figures – not happening. Still, the indicators are BULLISH on the short term.
As for the immediate direction of least resistance, that still may have a day or two to go on the up side but the Stochastic Oscillator has entered its overbought zone and has given the very early indications of a turn around of trend. For the next day or so I’ll go with the up side but not too enthusiastically.
SILVER
Although silver more than doubled the performance of gold this past week it has still not made it into new recent high territory. Silver still has 2.5% more to go to get to new recent high levels and 9% more to go to exceed the 2008 high. The two Merv’s Silver Indices are still underperforming those of the various gold sector Indices. Silver seems still to have some more proving to do before it comes back into speculative favor.
Looking at a short term chart of silver (not shown this week) although gold has made it into new highs silver is still below its mid-May high. The last two days has seen silver perk up but it still has a way to go. Still, the intermediate and short term indicators are all positive and the ratings are BULLISH. One indicator that is a concern is the volume indicator. Over the past month it has been following a basic lateral path and has not followed the price into higher levels, least of all into new highs. If the silver action does not strengthen over the next few days one must be very suspicious of the longevity of this latest upside move.
PRECIOUS METAL STOCKS
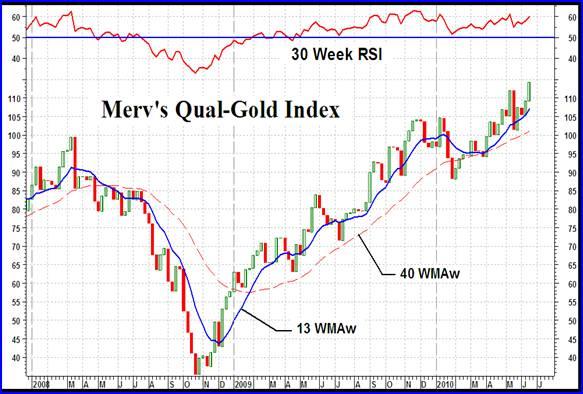
Shown this week is my quality gold Index, the Merv’s Qual-Gold Index. It includes the 30 largest gold and silver stocks traded on the North American markets, based upon their market value at the time of last update. I try to review and update the component stocks a few times a year. Although all of the major North American Indices have still not been able to move into new high territory, despite gold doing so, the Merv’s Qual-Gold Index is well into new all time highs. The Table of Technical Information and Ratings for the component stocks of this Index is provided each week to subscribers of the preciousmetalscentral service. The difference between the North American Indices and the Merv’s Indices has been explained often here. It is in the method of calculating the Index value. The North American Indices apply a greater weight to the largest stocks in their Indices giving them a larger effect towards the Index value calculation. The Merv’s Indices gives equal weight to each stock in the Index towards the Index value. What you get is the large stocks, such as Barrick, Newmont and Freeport (with performances since the end of last year of 18%, 29% and minus 18%) greatly affecting the Indices while in the Merv’s Indices the smaller Index stocks such as New Gold and Red Back (with performances of 81% and 88% since the end of last year) affecting the Index value equally.
Continuing to look at the Qual-Gold Index stocks, there was only one stock out of the 30 closing on the down side. Another interesting info, even though the 29 other stocks all closed on the up side not one of them had a double digit performance on the week. The Spec-Gold, Gamb-Gold and Penny Arcade Indices, although having multiple stocks declining on the week each had at least 10 stocks with double digit upside performances. Since the end of last year the most popular of the North American Indices (the PHLX Gold/Silver Sector Index) gained 7.9% to date, the Merv’s Qual-Gold Index gained 16.2% while the Merv’s Penny Arcade Index gained 30.1%. All sectors of the gold stock industry have been moving but as we can see the more speculative stocks have been moving by the greatest amount.
For the Merv’s universe of 160 gold and silver stocks (Penny Arcade not included) a full 82% of them closed the week on the up side while only 14% closed on the down side. Although there were 34 stocks with double digit weekly performances none made it into my super performance category of over 30%.
The week was good for the stocks but how long it will last is anyone’s guess. All of my Indices (the 160 as well as the various sectors) are showing a negative divergence in their long term momentum indicator. This is a warning of possible danger ahead, but at this point only a warning.
One thing to keep in mind, very often we see that the stocks react before gold itself reacts, either on the up side or the down side. We’re talking reacting into a reversal of major trend not just a minor movement. If this holds up we should see a change in trend direction in the major stock Indices, such as the Merv’s Gold & Silver 160 Index, before gold reverses. If you are watching the performance of gold as a guide towards your stock activities, you may be disappointed if the stocks do turn around weeks before gold does.
MERV’S PRECIOUS METALS INDICES TABLE
Well, that’s another week.
By Merv Burak, CMT
Hudson Aero/Systems Inc.
Technical Information Group
for Merv's Precious Metals Central
For DAILY Uranium stock commentary and WEEKLY Uranium market update check out my new Technically Uranium with Merv blog at http://techuranium.blogspot.com .
During the day Merv practices his engineering profession as a Consulting Aerospace Engineer. Once the sun goes down and night descends upon the earth Merv dons his other hat as a Chartered Market Technician ( CMT ) and tries to decipher what's going on in the securities markets. As an underground surveyor in the gold mines of Canada 's Northwest Territories in his youth, Merv has a soft spot for the gold industry and has developed several Gold Indices reflecting different aspects of the industry. As a basically lazy individual Merv's driving focus is to KEEP IT SIMPLE .
To find out more about Merv's various Gold Indices and component stocks, please visit http://preciousmetalscentral.com . There you will find samples of the Indices and their component stocks plus other publications of interest to gold investors.
Before you invest, Always check your market timing with a Qualified Professional Market Technician
Merv Burak Archive |
© 2005-2022 http://www.MarketOracle.co.uk - The Market Oracle is a FREE Daily Financial Markets Analysis & Forecasting online publication.