


Signs of Stock Market Concern in the Economic Recovery Process
Stock-Markets / Stock Markets 2010 Jun 20, 2010 - 05:21 AM GMTBy: Donald_W_Dony

 Economic recoveries generally take a fairly standard pattern. The stock market usually bottoms 4 to 8 months before the low in the business cycle. Risk levels that are associated with the final days of the bear market ease. Expanding Gross Domestic Product (GDP) gradually develops and improves. Rising unemployment numbers stabilize and begin to decline. Early advancing industrial groups, such as consumer discretionaries, transportation and technology start to strengthen and outperform. And central banks slowly increase short-term interest rates to keep the fledgling economy in-check. However, when specific signs of weakness remain after over a year of economic expansion, investors should take note.
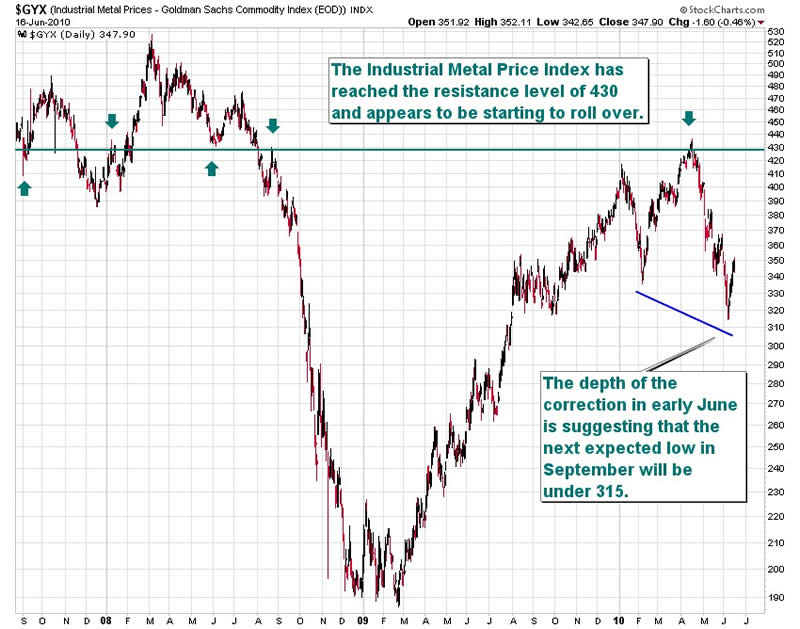
Industrial metals are one of the 'fuels' during a business cycle and often act as a 'barometer' on the economy. The utilization of lead, zinc, copper and nickel is primary in housing, manufacturing, construction and consumer goods. Metal prices typically show stable strength in the first phase of the cycle particularly during a period of secular $US decline (2000 to present).
After roaring upward in 2009, base metal prices appear to have stalled in 2010 and started to roll over (Chart 1). Some of the reason can be contributed to the recent bounce in the US dollar. Nevertheless, the weakness in price support does indicates an underlining pullback in buying pressure and a mistrust from traders about the continued recovery.
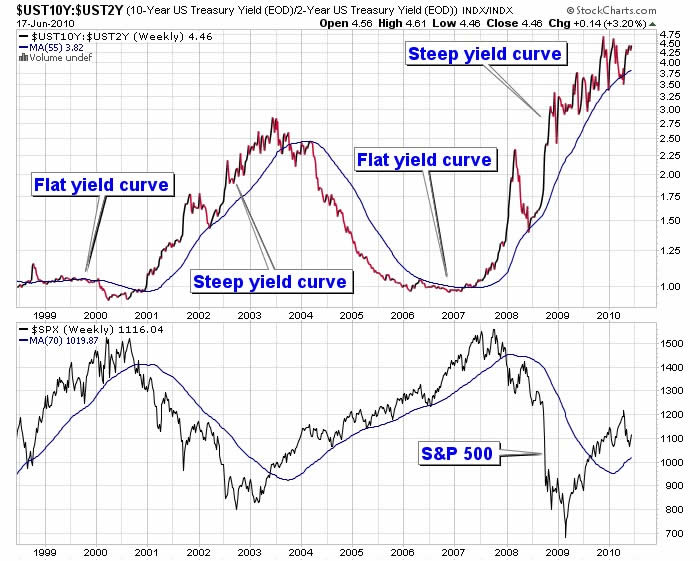
The yield curve (Chart 2) is a reflection on economic strength. During a typical recovery, upward pressure brings to build on short-term rates as the economy slowly gathers momentum. Within the first year of a new bull market, growth expands to the point where central banks begin to raise interest rates to keep the new economy from overheating too early. As short-term rates advance, the yield curve gradually begins the often long-term process of flattening. Under a 'normal' business cycle, the yield curve usually starts to decline within the first year. In the case of the present cycle, the curve has continued to steepen. This means that the standard economically-driven pressure on shorter one and two bond yields have not yet developed. And this is after over a year of an economic recovery. Demand remains firm for bonds across the curve.
The Volatility Index or VIX is a measure of risk on the S&P 500 (Chart 3). The understanding of this long established gauge can be best read by partitioning the index into zones. A reading of 18 or under represents a low risk period. This level is usually associated with the long upward advance of bull markets and steadily expanding economies. The zone of 18 to 33 normally corresponds to bear market declines and stock market crests and bottoms. The high risk zone of over 33 is usually entered for only a brief period as equity markets are reaching their final bear lows.
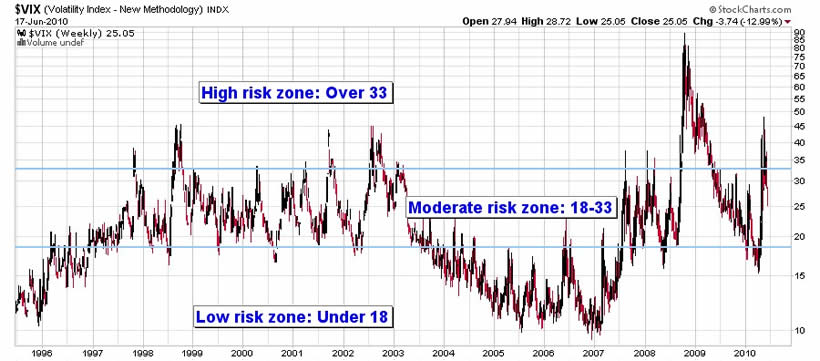
The elevated range in April and May 2010 illustrates a moderate to borderline high risk level that is typically not seen during a standard market correction. Pullbacks during the last bull market (2003 to 2007), only generated a risk level on the VIX of 20 to 22. The swift decline of stocks in May drove the VIX to over 40.
Bottom line: There are many economic areas of improvement and signs of investor confidence returning. However, the presence of weak industrial metal prices, a prolonged steep yield curve plus a continued overly high level of risk, translates into a heightened range of concern from investors about the strength of the economic recovery. None of these actions should normally occur after 15 months of a new bull market.
Investment approach: Models have implied that the markets move in approximately four month (16-week) trading cycles. With the completion of the last cycle in late May to early June, the next expected trough should arrive in September. This month has a 73% probability of negative returns based on 50 years of data. The signs of weakness in industrial metals, the prolonged steepness in the yield curve and the unusually high level of the VIX suggests investors may wish to take a more defensive stance during the next four months. These conditions maybe short lived but some additional protection is likely warranted now.
An easy method of providing extra protection in portfolios is to hold a higher cash position, a lower equity percentage or increased fixed income holdings.
More research will be in the upcoming July newsletter.
Your comments are always welcomed.
By Donald W. Dony, FCSI, MFTA
www.technicalspeculator.com
COPYRIGHT © 2010 Donald W. Dony
Donald W. Dony, FCSI, MFTA has been in the investment profession for over 20 years, first as a stock broker in the mid 1980's and then as the principal of D. W. Dony and Associates Inc., a financial consulting firm to present. He is the editor and publisher of the Technical Speculator, a monthly international investment newsletter, which specializes in major world equity markets, currencies, bonds and interest rates as well as the precious metals markets.
Donald is also an instructor for the Canadian Securities Institute (CSI). He is often called upon to design technical analysis training programs and to provide teaching to industry professionals on technical analysis at many of Canada's leading brokerage firms. He is a respected specialist in the area of intermarket and cycle analysis and a frequent speaker at investment conferences.
Mr. Dony is a member of the Canadian Society of Technical Analysts (CSTA) and the International Federation of Technical Analysts (IFTA).
Donald W. Dony Archive |
© 2005-2022 http://www.MarketOracle.co.uk - The Market Oracle is a FREE Daily Financial Markets Analysis & Forecasting online publication.