


Stocks Bear Market Do or Die Time, Gold Caution
Stock-Markets / Financial Markets 2010 Jun 20, 2010 - 05:55 AM GMT

 FDIC Friday anticipates a Summer break. -
The FDIC Failed Bank List announced only one new bank closure this week. Has the FDIC run out of money again? Their trouble bank list is well over 300, so they should be busier than this.
FDIC Friday anticipates a Summer break. -
The FDIC Failed Bank List announced only one new bank closure this week. Has the FDIC run out of money again? Their trouble bank list is well over 300, so they should be busier than this.
U.S. Stocks Advance to Finish Second-Straight Weekly Rally
U.S. stocks rose, with the Standard & Poor’s 500 Index advancing for a second week for the biggest back-to-back weekly gain since November, amid speculation Europe’s efforts to contain its debt crisis are succeeding. The S&P 500 rose 0.1 percent to 1,117.51 as of 4 p.m. in New York after falling as much as 0.2 percent. The Dow Jones Industrial Average gained 0.2 percent, or 16.47 points, to 10,450.64.
Greenspan Says U.S. May Soon Reach Borrowing Limit
Former Federal Reserve Chairman Alan Greenspan said the U.S. may soon face higher borrowing costs on its swelling debt and called for a “tectonic shift” in fiscal policy to contain borrowing. “Perceptions of a large U.S. borrowing capacity are misleading,” and current long-term bond yields are masking America’s debt challenge, Greenspan wrote in an opinion piece posted on the Wall Street Journal’s website. “Long-term rate increases can emerge with unexpected suddenness,” such as the 4 percentage point surge over four months in 1979-80, he said.
What Money on the sidelines?
(A liquidity) proxy might well be the plunging assets at money market funds: in the past week these saw a massive outflow of $37.9 billion, which represents a drop of 1.5% in total money market assets. ICI reports a record outflow from equity mutual funds, so it’s not going there.
The VIX may have finished consolidating last week.
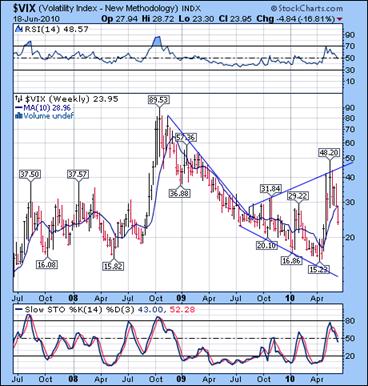 --The VIX dipped down yet another week to its Cycle Support at 22.82. This may be the last stop before moving higher in its uptrend. VIX is having its own upsurge in volatility as it makes a 50% retracement of its cyclical price range. The Broadening Formation allows for that as a prelude to an upside breakout.
The NYSE (weekly) Hi-Lo index rose to 41, maintaining its position in the bearish camp. The percentage of stocks selling above their 50-day moving average rose to 45.6% this week, but must go above 55% to achieve the upper half of its trading range.
The SPX meets time and price retracements.
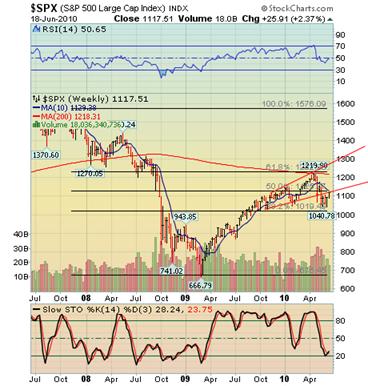 --The SPX closed at the 50% Fibonacci resistance, the 10-week moving average and trendline resistance this week. It is interesting to see how the wave 1 decline and its retracement fell within the Fib retracements of the larger bear market.
An article by Structural Logic points out that bear market rallies last 18-34 days, while bull market rallies typically last 39 days or longer. Monday happens to be the 18th trading day from the May 25th low. While the 50% retracement of the this decline is at 1130, the 50% retracement of the “big picture” is at 1225. Folks, we may have already arrived.
The NDX also meets time and price retracements.
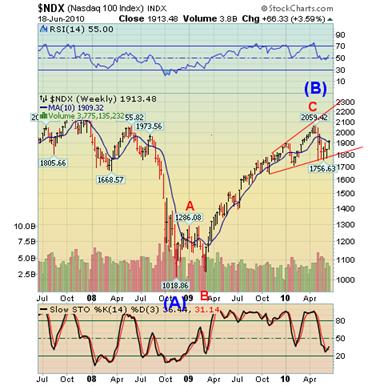 --The NDX closed slightly above its 50% Fibonacci retracement at 1906.00 this week. The Broadening Formation calls for such a move (not 61.8%) for the trap door to swing open. What traders have been used to are the right-translated cycles of the rally, which last much longer. The fact is, we must now get used to the left-translated cycles that are typical of the bear market.
The Primary Cycle decline referred to in the Structural Logic article dominates bear markets. This is what allows crashes to occur, since it may allow a longer time span for a decline to occur, while bull markets chop higher in a shorter Trading Cycle. Monday is the next pivot day.
A word of caution on Gold.
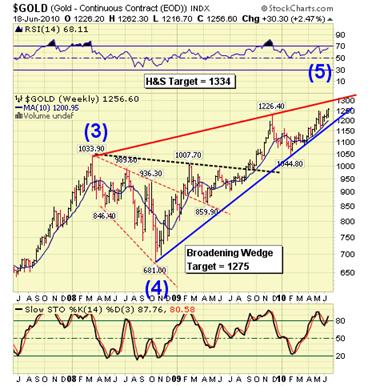 -- Gold now appears to have completed most or all of the requirements of wave (v) of 5, its final surge before its collapse. Now we must examine the limitations of this rally. The Broadening Wedge target is still in progress and has an 81% probability of success. The upper trendline of the larger bearish wedge is at 1300, so it appears that it may be final resistance.
Many analysts are using the inverted Head and Shoulders pattern to call for a rally to 1334 and even higher. A wave (4) decline is not an ideal place for a Head and Shoulders Pattern, unless wave (5) can extend. Second waves are better locations for Head and Shoulder patterns, since third waves are the most likely to extend to meet the H&S target.
Oil hits overhead resistance.
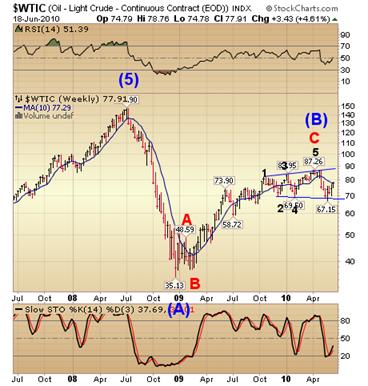 --$WTIC extended its bounce inside its Broadening Formation and has stopped short of its 61.8% Fibonacci Retracement. This is a little higher than what is normally expected in the Orthodox Broadening Top formation. Now we can finally say that the retracement may be finished, since it closed at its 10-week moving average.
If we view this as a complex head and shoulders pattern, with this week’s action representing the right shoulder, the next target is 49. This generally agrees with the average decline from a broadening top falling in the area of 50-52.
The Bank Index makes a weak retracement.
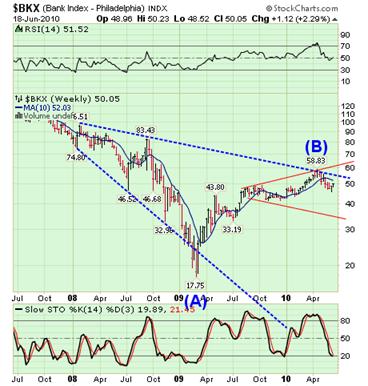 --The much weaker consolidation in the $BKX is indicative of its leadership to the downside. Its Orthodox Broadening Top still needs to be completed to the lower (red) trendline.
The next target for $BKX is 32, provided it does not extend. That means that the BKX as well as the other indices (except gold) will have all fallen to the bottom trendline or below their Broadening Top formations in the very near future.
The Shanghai Index may be reversing higher.
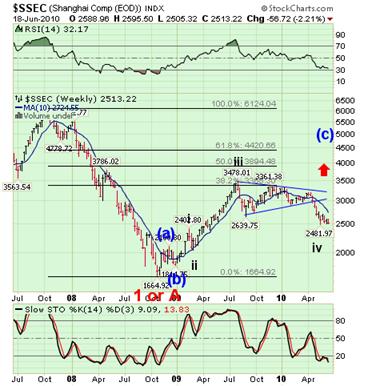 --The Shanghai Index has come very close to a new low, but until it does, I am treating this move as part of a reversal pattern to the upside. The pivot low of May 21st appears to be still in play. Shanghai still has some work to do, but it is still interesting to observe the divergences between the U.S. equities markets and China’s markets.
The reason that I hold that opinion is that May 17th was an ideal date for the $SSEC Seasonal cyclical low. The actual low was on May 21st, only 4 days later. Combine that with the appearance of the triangle formation and the minimal Fibonacci retracement of its 2007-2008 decline and there may be room for a rally to the 50% or 61.8% retracement levels before the next major decline in China stocks.
$USB confirms one more surge to higher ground.
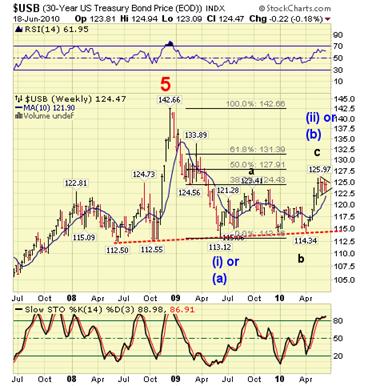 -- $USB took more time to consolidate its 4th wave pattern into a triangle pattern. This confirms one more move higher that may meet or exceed its 61.8% retracement level.
The Fibonacci 61.8% retracement agrees with the upper resistance given by my cycle model, so we should continue to expect that target to be realized.
$USD appears poised to meet its Head and Shoulders target.
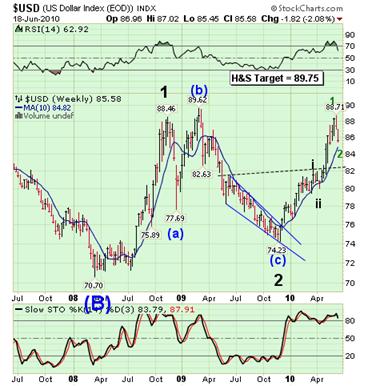 -- $USD has made a two week correction and may be ready to meet or exceed its Head and Shoulders target at 89.75 as early as next week. Should it reverse on its pivot on Monday, it is poised for a major breakout to higher ground in a third degree third wave. Unlike the long bond, however, the trend will remain up for a much longer time period.
The dollar bears are still out, but will disappear completely when the breakout occurs. By the way, the Euro is heading below parity.
I hope you all have a wonderful weekend!
Regards,
Tony
Traders alert: The Practical Investor is currently offering the daily Inner Circle Newsletter to new subscribers. Contact us at tpi@thepracticalinvestor.com for a free sample newsletter and subscription information.
Our Investment Advisor Registration is on the Web
We are in the process of updating our website at www.thepracticalinvestor.com to have more information on our services. Log on and click on Advisor Registration to get more details.
If you are a client or wish to become one, please make an appointment to discuss our investment strategies by calling Connie or Tony at (517) 699-1554, ext 10 or 11. Or e-mail us at tpi@thepracticalinvestor.com .
Anthony M. Cherniawski, President and CIO http://www.thepracticalinvestor.com
As a State Registered Investment Advisor, The Practical Investor (TPI) manages private client investment portfolios using a proprietary investment strategy created by Chief Investment Officer Tony Cherniawski. Throughout 2000-01, when many investors felt the pain of double digit market losses, TPI successfully navigated the choppy investment waters, creating a profit for our private investment clients. With a focus on preserving assets and capitalizing on opportunities, TPI clients benefited greatly from the TPI strategies, allowing them to stay on track with their life goals
Disclaimer: The content in this article is written for educational and informational purposes only. There is no offer or recommendation to buy or sell any security and no information contained here should be interpreted or construed as investment advice. Do you own due diligence as the information in this article is the opinion of Anthony M. Cherniawski and subject to change without notice.
Anthony M. Cherniawski Archive |
© 2005-2022 http://www.MarketOracle.co.uk - The Market Oracle is a FREE Daily Financial Markets Analysis & Forecasting online publication.