Gold Bull Market Breakout As Credit Crunch Creates Flight to Quality
Commodities / Gold & Silver Sep 07, 2007 - 10:16 AM GMTBy: Jordan_Roy_Byrne
 On Thursday, December Gold leaped $14 to $704, while the continuous spot contract gained about 2% to 694. More impressive to me was how the mining stocks acted. Recently I had mentioned that I thought the gold stocks would begin to take their cue from gold rather than stock market, when gold exceeded $700. Today's action certainly validated that. The XAU was up 5.7% and the HUI rose 6.6%. One day does not make a trend, but if you are a gold bull, you have to like the present situation.
I have so many informative charts to show, but I had to break it down to the most pertinent. There still are quite a few in this update.
GOLD STOCKS
First, here is a weekly chart of the XAU:
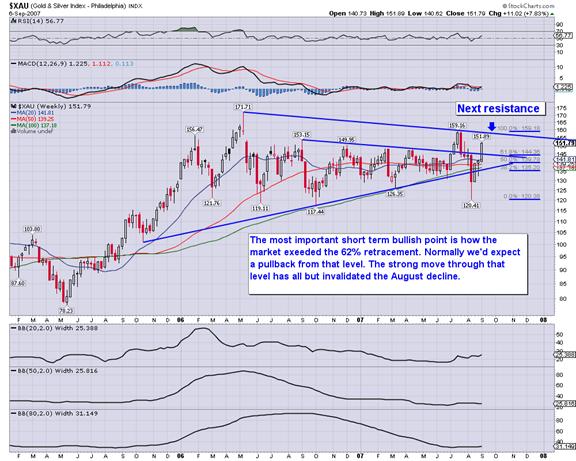
As I noted on the chart, the most important bullish point is the way in which the XAU blew by its 62% retracement point at 144. Days after the bottom, I wrote that I expected the XAU's rebound to peak around 140 where there was a cluster of moving averages and the 50% retracement. Instead, gold was able to blow right past resistance (139-144). The next point of resistance is noted on the chart. I am not quite ready to say that this run will lead to new highs, but a weekly or monthly close over 160 would turn me very bullish. Lastly, I'd like to comment on the long-term setup of this chart. The moving averages are bullishly aligned while volatility (as measured by Bollinger Band width) for short, mid and long term periods is at a low, consistent with the inception of big moves.
Next is a weekly line chart showing the XAU divided by the S&P 500:
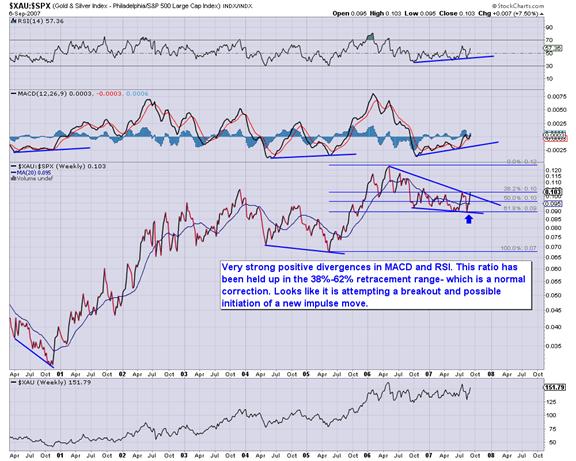
This is one of my favorite indicators and I believe that gold analysts don't use this enough. Investors buy gold and gold stocks because more normal, mainstream things are in bad shape. You never see gold stocks make a major move on the back of a strong stock market. As you can see from this chart, both the XAU and XAU/SPX tend to follow each other. Since this spring I have said that gold stocks cannot make another impulse move until they start outperforming the stock market. To measure that relationship I use the XAU and the S&P 500.
The indicators look very good here as both the RSI and MACD have positively diverged from the ratio, which is close to breaking out from a falling wedge pattern. While this looks very bullish we have yet to see a confirmed breakout. With the stock market sitting at resistance, we need to see how gold stocks perform in the coming days.
GOLD
Now before we turn to gold I am going to start with the US Dollar. It seems as though everyone is saying, “The Fed will cut rates, the dollar will fall and gold will rise.” I agree with this comment in the long term but for the near term I have a different view. Take a look at the dollar and both gold and the HUI below.
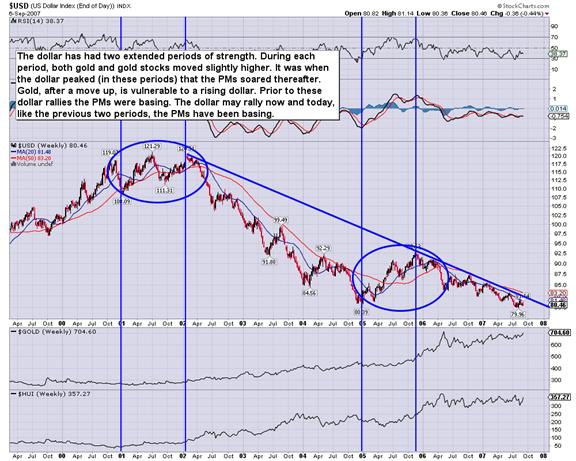
What we can see is that during the major bottoms for gold and gold stocks (2001 and 2005), the dollar has actually rallied along with the gold market. The gold market really took off when the dollar's rallies ended. Currently, the dollar is at long-term support (80) and gold and gold stocks are at a similar point to where they were in 2001 and 2005.
Credit crunches create a “flight to quality” and a flight to cash. The US Dollar is still the world's reserve currency so it benefits. Gold is money, so it benefits as well. The perception is that silver is not money (even though it is), so that is why it has lagged gold in recent months. Hopefully this helps to explain why gold and the US dollar can rise together. Ultimately, when US policy makers begin to inflate in earnest, the dollar should resume its secular decline.
With all this talk about the Fed and the dollar, investors can lose sight of the importance of gold priced in other currencies. As we can see from the chart below, in June of 2005, gold priced in various foreign currencies began to strongly trend higher. It wasn't until September that gold priced in dollars began to really takeoff.
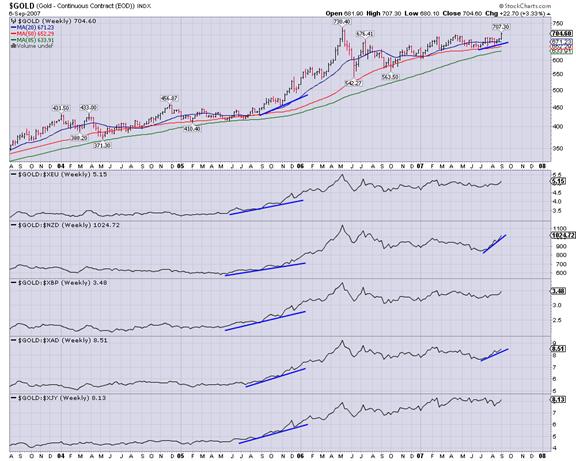
What can we conclude from these two charts? Over the next few months, we could see a period similar to summer of 2005. Both gold and the dollar move up, and gold's greatest gains come against foreign currencies. Perhaps it isn't until early 2008 when the dollar resumes its secular decline and pushes gold past its old intraday high of $888.
Before I conclude, I have two more charts. First, a weekly look at gold:
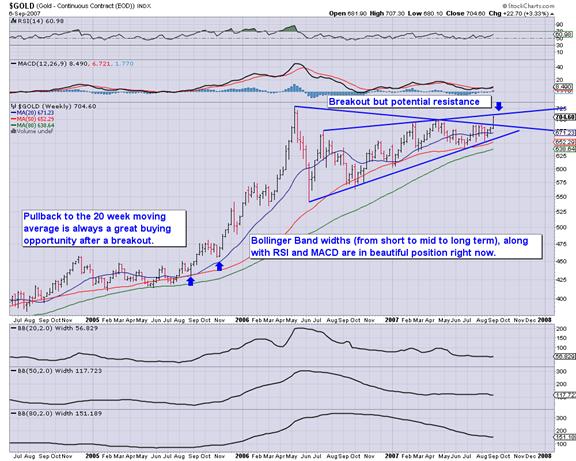
There is potential resistance less than one percent above the current point. Other than that, this move should take us to $730, the May 2006 high.
Here is an interesting long-term chart:
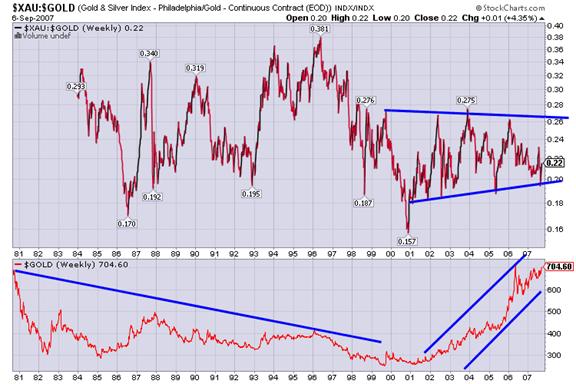
This chart shows the ratio of XAU/Gold and also the price of gold. Gold has been in a bull market since 2001, yet the XAU/Gold ratio was higher when gold was in a bear market. I find this kind of odd. You would think that gold stocks would be valued higher (against gold) when the price of gold is rising. A possible explanation is that the tech boom of the late 90s, and the emerging markets boom of the past few years, has driven investor funds into those areas and away from gold stocks. Nevertheless, if the bull market in gold continues, you can expect the XAU/Gold ratio to soar. Simply put, this is a divergence that will not last.
CONCLUSION
In the coming days and weeks, I will be anxiously watching the PMs as the S&P 500 is at critical resistance and due for a decline. For the most part, I do believe the gold stocks can weather a bearish stock market. On days of 1-2% declines in stocks, gold stocks should struggle. However, a grinding (back and forth) downward trend in the stock market will have much less effect (on gold stocks) than sharp declines.
For more fundamental and technical analysis on the gold, stock and commodity market, you can sign up for my free newsletter on the newsletter page of my website.
By Jordan Roy-Byrne
trendsman@trendsman.com
Editor of Trendsman Newsletter
http://trendsman.com
Trendsman” is an affiliate member of the Market Technicians Association (MTA) and is enrolled in their CMT Program, which certifies professionals in the field of technical analysis. He will be taking the final exam in Spring 07. Trendsman focuses on technical analysis but analyzes fundamentals and investor psychology in tandem with the charts. He credits his success to an immense love of the markets and an insatiable thirst for knowledge and profits.
Jordan Roy-Byrne Archive |
© 2005-2022 http://www.MarketOracle.co.uk - The Market Oracle is a FREE Daily Financial Markets Analysis & Forecasting online publication.


