Must Watch Stock and Commodity Market Signals
Stock-Markets / Financial Markets 2010 Jun 21, 2010 - 09:13 AM GMTBy: Larry_Edelson
 A couple times a year I like to give you what I call my roadmaps of the markets. They are charts based on actual signals from my computer models.
I watch these signals very closely because they tell me when a fork … speed bump … or U-turn is coming in the markets. They are critical signals, and they should not be ignored.
Moreover, after 32 years of developing and fine-tuning my systems, I can confidently say that the economic models they are based on are right far more often than they are wrong. I consider them indispensible, and they are my main forecasting tools.
If I were you, I’d print out this issue, highlight the important signals below, and keep this column by your computer.
Key Market Roadmaps I’m Giving You Today …
Let me start with a couple of main points I want to make about the markets right now, gleaned from my models. Then I’ll show you the charts and give you my proprietary big picture signals to watch.
First: A big correction in the broad stock markets is coming. The warnings come from the same models that alerted me to the bottom of the stock market in March 2009, and projected its subsequent rally to over 10,000. Not to mention a slew of big moves in the markets since 1985.
So that gives you an idea of how important and accurate they are. Specifics in a few minutes.
Second: The same models are telling me that while broad stock markets may slump sharply over the next few months …
A. The March 2009 low at 6,469 in the Dow and 667 in the S&P 500 were major lows, and the broad stock markets are now back in long-term bull markets headed to new record highs by 2015.
That should not surprise you, as I’ve often said the markets bottomed in 2009.
The main point I want to make, however, is that the upcoming weakness I expect in the broad stock markets will be an opportunity to start loading up for a bull market that almost no one will see coming.
Why won’t they see it coming? For all the reasons I’ve been citing all along. Namely because they cling to old economic rules of thumb.
And because they fail to realize that the sovereign debt crisis is really a third-world debt crisis in the first world. Which, in turn, means that the first world’s currencies, the euro and the dollar, will be devalued to reinflate the stock markets.
Just like what’s previously happened in almost every emerging economy in the world, from Argentina to Brazil … from Indonesia and Thailand … to Chile and Peru.
Meanwhile …
B. Asian economies and markets will zigzag higher, even while the U.S. markets plunge in the short term. China and India remain in long-term bull markets, and will see new record highs in the years ahead.
Ditto for Singapore, Taiwan, Hong Kong, and even Thailand, Sri Lanka, Indonesia and Malaysia.
There are multiple reasons and forces driving Asia higher, and they will persist for decades to come.
And last, but certainly not least …
Third: The natural resource sector will outperform virtually all other sectors, and by miles. Their long-term bull markets are very much intact, and have much more to go on the upside.
Now, to the key must-watch signals you should be monitoring on a more short-term basis …
Gold: Gold is now consolidating its back-to-back new record highs that it made in May and June. As you can see from the chart on gold, support underneath the market continues to strengthen, and rise going forward. A bullish sign.
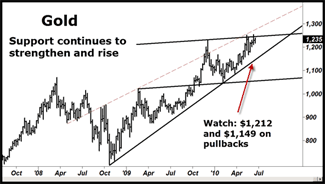 |
The short-, intermediate- and long-term indicators are also very bullish for gold. Short term, look for gold to make yet another new record high, on its way to the $1,350 level.
However, it won’t be a straight line up. There will be zigs and zags higher. Important support lies at $1,212 followed by $1,149.
Between $1,149 and $1,212, gold is essentially neutral short term. So watch those two support points. Core long-term gold positions should be accumulated on any pullback into that trading range.
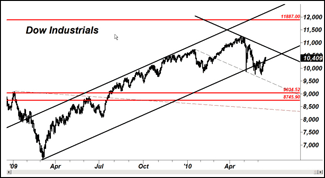
The Dow Jones Industrials: I’ve nailed the Dow consistently for years, nearly every one of its major turning points. The latest series of calls: The entire rally from the 2003 lows into the 2007 high. The bear market into 2009 … the 2009 low, to the week … and the subsequent rally, which my systems fine-tuned and projected a high near 11,250, and which was hit on April 26 (11,258.01).
Now, after the initial leg back to the downside, my systems are showing the following critical signals …
 |
![]() 11,887 on the upside.
11,887 on the upside.
![]() 9034.52 and 8745.94 on the downside.
9034.52 and 8745.94 on the downside.
What do these figures mean? They’re not generated from the chart. I’ve put them on the chart for you with horizontal red lines: They are mathematically generated signals that are very important. In essence, MAJOR SUPPORT in the Dow now resides at 9,034.52 and 8,745.94.
In the worst case, the current pullback in the Dow should find a bottom at one of those two levels. On the other hand, when the Dow closes above 11,887 — it will be off to the races and new record highs.
When would that happen? Not until after we get a test of one of the two downside levels.
As you can also glean from that chart, the Dow is not all that bearish looking. It has come a long way from its March 2009 low, and a healthy correction is now in order.
Cycle charts (not shown) also support a decline now. Long term, the Dow’s next major cycle turning points are in 2012 and 2015.
I have no doubt we will see new record highs in the Dow by 2015, surprising almost everyone, as the Dow begins to reflate on the back of devalued currencies, especially the dollar and the euro.
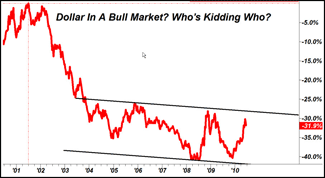 |
The Dollar: This chart is a percentage change chart of the U.S. Dollar Index since its 2001 high. It gives you a better perspective of the dollar.
The dollar is still clearly in a long-term bear market, and as you can see, still down more than 31% from its 2001 high!
Not shown on the chart: My key system reversals, which are …
![]() 92.38 and 107.81 on the upside
92.38 and 107.81 on the upside
![]() 82.43 and 80.41 on the downside
82.43 and 80.41 on the downside
It would take a closing above 107.81 in the dollar index to establish a new bull market in the dollar that would surpass the 2001 high. I consider that highly unlikely.
On the other hand, as you also see from the chart, the Dollar Index has already met very stiff resistance at the 89 level, and is likely to start turning lower.
A close below the 82.43 level would put the Dollar Index squarely back in a bearish mode in all trend levels: Short, intermediate, and long term.
Next …
Oil: Despite the dramatic decline from its $147 high in July 2008, oil is still very much in a long-term uptrend, and I expect it to hit $200 a barrel, as soon as 2012.
But short term, it’s in a very wide trading range defined by $81.48 on the upper end, and $68.73 per barrel on the lower end.
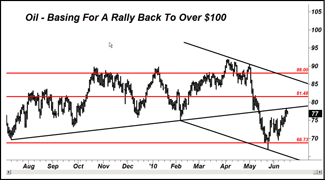 |
A close back above $81.48 a barrel, and I have absolutely no doubt we will then see $88 oil.
A close above $88 and oil is destined for $200 longer term.
Right now, I expect oil to swing pretty wildly, and would not rule out a retest of the $68 level.
But I would welcome it as a fantastic opportunity to aggressively buy oil and energy and related shares.
Last roadmap for today, a key base metal to keep your eyes on …
Copper: Often referred to as “Dr. Copper” — copper is a leading indicator for the global economy. It’s also a very important indicator of the state of China’s economy, as it is critical to building out housing and infrastructure in the Middle Kingdom, and is one of China’s largest imports.
Copper is currently trading at about $3.00 a pound, nearly 116% higher than its 2008 financial crisis panic selloff that saw copper fall from over $4.00 to $1.40.
For the record: My long-term work in copper shows its bull market very much intact, and I expect to see “Dr. Copper” hit $6.00 a pound by 2012, 2015 at the latest. In other words, it should double over the next two to five years.
The two signals you want to watch, shorter term …
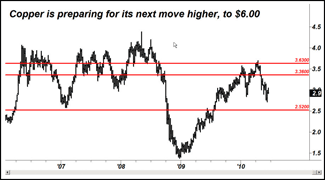 |
![]() $3.36 and $3.63 on the upside
$3.36 and $3.63 on the upside
![]() $2.52 on the downside
$2.52 on the downside
In between, copper is neutral short term. Once it closes above $3.63, however, the metal is off to the races … to new record highs.
Major support lies at $2.52 where I would be a very aggressive buyer of copper and copper shares.
Stay tuned … watch these signals … and as I noted previously, feel free to print this article out and keep it by your computer.
Best wishes,
Larry
P.S. If you’re a Real Wealth Report subscriber, naturally I monitor all these signals and more for you. And of course, you get all my recommendations. If you’re not a Real Wealth member, for whatever reason, it’s simple to join. To find out how, click here now.
This investment news is brought to you by Uncommon Wisdom. Uncommon Wisdom is a free daily investment newsletter from Weiss Research analysts offering the latest investing news and financial insights for the stock market, precious metals, natural resources, Asian and South American markets. From time to time, the authors of Uncommon Wisdom also cover other topics they feel can contribute to making you healthy, wealthy and wise. To view archives or subscribe, visit http://www.uncommonwisdomdaily.com.
© 2005-2022 http://www.MarketOracle.co.uk - The Market Oracle is a FREE Daily Financial Markets Analysis & Forecasting online publication.


