


Can Stocks Bulls Lift a Market Threatened By Economic Stimulus Uncertainty?
Stock-Markets / Stock Markets 2010 Jun 28, 2010 - 06:09 AM GMTBy: Money_Morning

 Jon D. Markman writes: Stocks spilled the past week like water over a broken dam as investors priced in more evidence that consumers, businesses and home-buyers have gone on strike despite U.S. stimulus measures and record-cheap interest rates that have put mortgages, car loans and store-credit costs at 100-year lows. In the five-day span, the Dow Jones Industrial Average fell 2.5% and the Standard & Poor's 500 Index sank 3.6%; Nasdaq and Russell 2000 Index all fell 3.2%.
Catalyst for the latest spasm of selling came from disappointing news on durable goods sales and initial jobless claims, and weak earnings news or outlooks from consumer-facing companies Bed Bath & Beyond Inc. (Nasdaq: BBBY), Darden Restaurants, Inc. (NYSE: DRI), Lennar Corp. (NYSE: LEN) and Nike, Inc. (NYSE: NKE).
All of the major U.S. and global indexes are now below their 200-day averages for the first time since early June.
Here's why it matters: The first time that stocks fall below these lines amid an uptrend it's often dismissed as an "over-shoot" and prices are expected to bounce back quickly.
But when major indexes sink back under their 200-day averages two or more times after short-term bounces higher, the implication becomes increasingly negative. And the recent ones are particularly bothersome since they occur at a time of intense efforts by the government to pump the economy.
THE 40-WEEK WOBBLE
We cannot say that the U.S. government isn't trying to help. It's trying, but it isn't gaining traction because families don't have the confidence to spend as freely as in the past. Businesses are hoarding cash and not hiring, and banks aren't lending because regulators are warning them not to mess up.
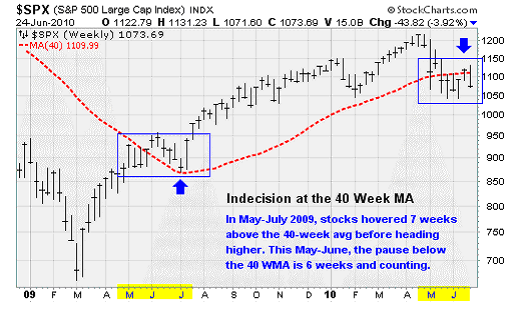
The chart above brings the current period of intense volatility into clearer focus. Rather than use daily bars, which can be confusing and erratic, I'm using weekly bars. The 40-week average is the same as the 200-day average, but in a more streamlined form.
And what you can see here is that the benchmark index is trapped in a range of indecision below the 40-week average that is virtually a mirror image of the range of indecision that occurred when the market was moving above the 40-week average exactly a year ago. Back then there was optimism that the world's governments were working together on a solution to right the ship amid the credit crisis. Now we're witnessing the opposite: Pessimism that the efforts haven't worked out.
If this pattern of indecision continues to unravel in the mirror-image manner, about another week or two of hovering under the 40-week average will give way to a definitive move lower, breaking the 1,040 level that has so far proven to be the floor of the current range. If that occurs in a week, it would be catalyzed by an unsettling report on June unemployment, which will be released on July 2. If it occurs in two or three weeks, it would be catalyzed by worse than expected Q2 earnings reports from major companies; Alcoa Inc. (NYSE: AA) will be first, as usual, on July 12.
You can see in the chart that this has not been a great time for big bets on either the long or the short side. A heavy allocation on either side is a recipe for being chopped up. The time to make big bets will come when institutional investors finally decide to push the market higher or lower out of this range in a definitive way. I sincerely doubt it will occur on a spike higher or on a crash lower. There has already been so much price discovery that the winning side will most likely push forward gradually, like a train pulling out of a station rather than a rocket ship leaving a launch pad.
Optimists have a lot of good reasons to imagine that they're going to win this thing. The oldest rule in the book is, "Don't fight the Fed." And there are rumors now that suggest the Fed will defy the austerity plans of its European and Australian counterparts and support U.S. equities and bonds by actually doubling its balance sheet to $5 trillion in an unprecedented spending spree.
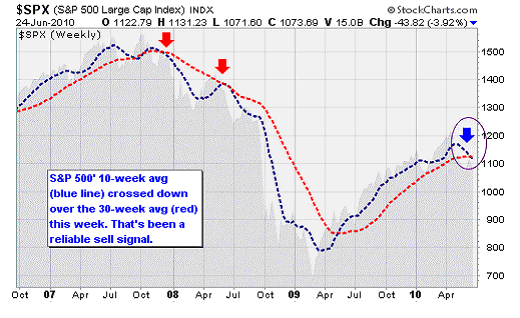
THE 30-WEEK CROSS
But one reason to suspect that pessimists, or bears, may be gaining the upper hand is provided by another view of the S&P 500 chart. Sundial Capital Research told clients on Wednesday -- leaning on work by Tom DeMark -- that crosses of the 10-week average over and under the 30-week average give fairly reliable buy and sell signals.
Sundial correctly observed that most trend-following strategies have a very low winning percentage -- i.e. they're wrong a lot -- but they can still be profitable since they catch the really big trends. Sundial noted that this strategy has been better than most, avoiding a lot of whipsaws. While the winning percentage is only 42% since 1928, the average winner was an impressive +16.2% (until the next buy signal was given). The average loser, though, was an uncomfortable -9.1%, which happens when the market rebounds hard from short-term selloffs.
Looking over Sundial's results, I noticed that almost all of the failed sell signals occurred in the 1990s, which was a secular bull market. Since 2000 we've been in a secular bear market, and the results have been better: four out of five have been winners (+17% starting 10/27/00; +13.9% starting 5/10/02; -13% starting 2/14/03; +7.4% starting 12/14/07; and +30.6% starting 6/27/08). In this case, a positive result means the market went down after the signal.
As you can see in the chart above, the 10-week/30-week downside crossover just occurred this week.
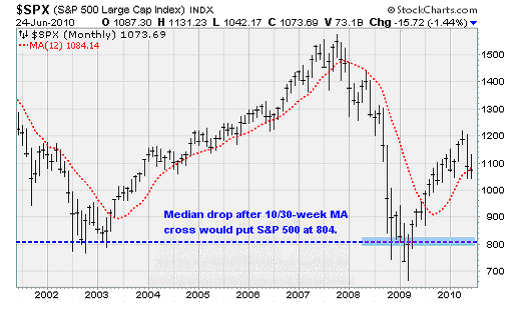
If we take a median of the five down-cross results since 2000, we get -11.2% until the next buy signal. However the maximum short-side gains of those five were 27.1%, 5.5%, 14.4% and 47.8%, for an average of 25.3%. Were that to recur, the decline would extend to the 804 level of the S&P 500, as shown above. Interesting coincidence that it's a hair above the March 2009 close. If we take out the 2008 example as a once-in-a-generation flop, the average max decline is still 19.6%, which would put the benchmark index at 862.
This is all just math based on historic events. With so few examples it's dangerous to draw firm conclusions. But it does show that the 10-week/30-week cross is nothing to mess around with. We can hope that it doesn't matter this time, but hope is not usually a great investment strategy.
Since the first week of July tends to be bullish, it is fair to expect at least a modest rebound in the next couple of days. With any luck, the market could advance to 1,115 on the S&P 500, or even as high as 1,140.
However it's certainly beginning to look like the larger trend is headed lower, unfortunately. And if that is the case any rebound that materializes in the next week or two should be used to sell risky long positions, add more investment-grade and government bond funds, and hunker down for the fall and winter. Bulls can blunt this view by taking the market up above 1,115 for at least a week, but they better get cracking.
END OF FREE MONEY?
Setting aside jobless claims, retail sales, and other economic detritus, the single most important thing you need to know for the coming weeks is that the Federal Reserve is quietly tightening up on credit. Veteran market watcher Tom McClellan of the McClellan Market Report believes this has been the largest contributor to recent market volatility -- including the May 6 "flash crash" event.
While the Fed left its interest rate unchanged after its two-day policy meeting last week, that hasn't kept the central bank from stealthily sucking cash out of the financial system.
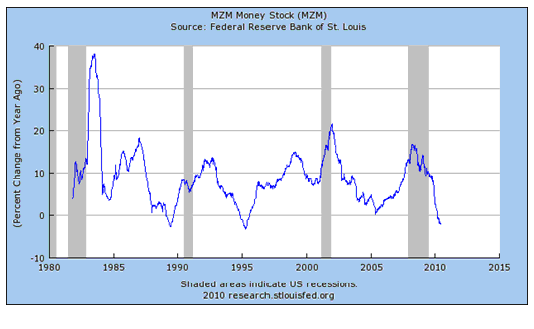
One measure of money, known as "money zero maturity" or MZM, is now contracting for the first time in 15 years. MZM represents currency in circulation as well as deposits that could be withdrawn at anytime, such as checking and savings accounts. After growing at an annual rate of more than 4% in early 2009, MZM started contracting in March and is now falling at a rate of 2%.
The era of easy money and 0% interest rates is stealthily coming to an end. And as a result, the stock market is becoming more volatile as traders react to the withdrawal of cash from the system. With less money to borrow, McClellan believes the hedge funds have been caught flatfooted as money became harder to borrow and lending rates from their brokers started to climb. Even algorithmic, trend-seeking quantitative trading programs are subject to these monetary forces.
That leaves Mr. Market in the uncomfortable position of seeing money becoming more expensive while at the same time the economy begins to stutter. Not a good combination. And that's why the market has softened so much in June.
Week in Review
Monday: No major economic releases.
Tuesday: Existing home sales for May came in well under expectations at an annual rate of 5.6 million units compared to analyst expectations for 6.2 million units. Supply remains heavy at 8.3 months of sales. The overall impression is that the housing market is in the midst of a soft spot after demand was pulled forward due to the now expired homebuyer tax credit.
Wednesday: More bad news on the housing front when new home sales for May were reported to have fallen to the lowest levels since data started being collected in 1963. Sales were down 33% for the month to an annual rate of 300k. Supply surged to 8.5 months of sales from April's 5.8 months. The Federal Reserve concluded its policy meeting by leaving interest rates unchanged.
Thursday: Durable goods orders, a notoriously volatile report, fell 1.1% in May -- worse than the consensus estimate of a 0.5% decline. Still, there was strength in the details of the report. Excluding transportation orders, new durable orders increased 0.9% following a 0.8% decrease in April. Weekly initial jobless claims dropped 19k to 457k.
Friday: First quarter GDP growth was revised down to 2.7% from 3% previously and the initial estimate of 3.2%. The final numbers reflect an increase in imports and a decrease in personal expenditures.
The Week Ahead
Monday: Report on personal income will provide an update on wage growth -- which has shown surprising strength recently.
Tuesday: The latest on the housing market courtesy of the Case-Shiller Home Price Index. Also, new consumer confidence numbers will be released.
Wednesday: Ahead of Friday's big jobs report, the ADP Employment Report will provide an advance look at the job market based on private payrolls.
Thursday: A heavy calendar with vehicle sales, weekly initial jobless claims, pending homes sales, and the ISM Manufacturing Index.
Friday: The employment situation report for June will be released.
[Editor's Note: Money Morning Contributing Writer Jon D. Markman has a unique view of both the world economy and the global financial markets. With uncertainty the watchword and volatility the norm in today's markets, low-risk/high-profit investments will be tougher than ever to find.
It will take a seasoned guide to uncover those opportunities.
Markman is that guide.
In the face of what's been the toughest market for investors since the Great Depression, it's time to sweep away the uncertainty and eradicate the worry. That's why investors subscribe to Markman's Strategic Advantage newsletter every week: He can see opportunity when other investors are blinded by worry.
Subscribe to Strategic Advantage and hire Markman to be your guide. For more information, please click here.]
Source : http://moneymorning.com/2010/06/28/u.s.-stimulus/
Money Morning/The Money Map Report
©2010 Monument Street Publishing. All Rights Reserved. Protected by copyright laws of the United States and international treaties. Any reproduction, copying, or redistribution (electronic or otherwise, including on the world wide web), of content from this website, in whole or in part, is strictly prohibited without the express written permission of Monument Street Publishing. 105 West Monument Street, Baltimore MD 21201, Email: customerservice@moneymorning.com
Disclaimer: Nothing published by Money Morning should be considered personalized investment advice. Although our employees may answer your general customer service questions, they are not licensed under securities laws to address your particular investment situation. No communication by our employees to you should be deemed as personalized investent advice. We expressly forbid our writers from having a financial interest in any security recommended to our readers. All of our employees and agents must wait 24 hours after on-line publication, or 72 hours after the mailing of printed-only publication prior to following an initial recommendation. Any investments recommended by Money Morning should be made only after consulting with your investment advisor and only after reviewing the prospectus or financial statements of the company.
Money Morning Archive |
© 2005-2022 http://www.MarketOracle.co.uk - The Market Oracle is a FREE Daily Financial Markets Analysis & Forecasting online publication.