Stock Market Breaks Neckline, Gold Trending to Below $1200
Stock-Markets / Financial Markets 2010 Jul 01, 2010 - 05:35 AM GMT

 U.S. stocks fell, extending the market’s first quarterly retreat in more than a year, after Moody’s
Investors Service’s warning that it may downgrade Spain snuffed out an earlier rally.
The Standard & Poor’s 500 Index fell 1.1 percent to 1,030.11 at 3:45 p.m. in New York. It has
declined 12 percent since March 31, breaking a four-quarter winning streak that drove the
benchmark index for U.S. stocks up 47 percent. The Dow Jones Industrial Average fell 115.44
points, or 1.2 percent, to 9,754.86.
Bill Fleckenstein Says You Can't Trust S&P PE Multiples As All The Financials' Earnings "Are Pure Nonsense"
A casually dressed Bill Fleckenstein was on Bloomberg TV bursting assorted myths and bubbles. First, Bill discusses how the market is no longer a discounting mechanism, noting that "after having completely ignored the bursting of the dot com and the real estate bubbles, I think this a function of the fact that since Greenspan took over the Fed and serially bailed out bigger and bigger problems with more and more easy money, the market evolved into much more of a speculative casino, and a lot more momentum type traders began to operate and everything always resolved itself on the upside... We have had much more of a speculative market that seems not to discount problems."
Goldman Technician Says To Short Market Unless S&P 1083 Is Recovered Today
(ZeroHedge) …we present the following piece of technical analysis from Goldman's Tony Pasquariello. According to the technician, a critical level to watch is the 12-month moving average, which many consider a critical indicator of upward (or downward momentum). According to Goldman, "unless S&P recovers the 1083 level today, we will have crossed down and through the moving average. On this simple basis, the technical signal is to be short the market." Do you think Goldman was already short?
VIX retested intermediate-term Support.
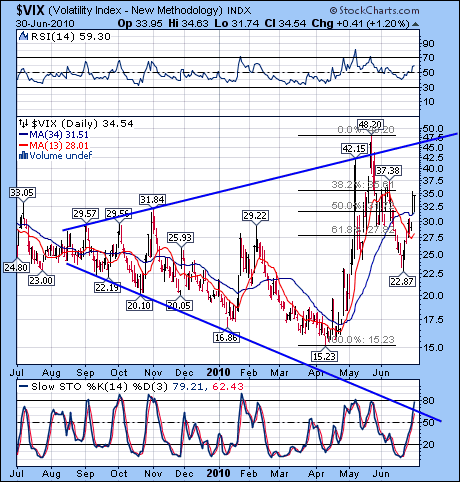 -- VIX retested intermediate-term
Trend Support at 31.51 before
closing higher today. This is clearly
the beginning of a third wave, where
Head & Shoulder necklines and
Broadening Top trendlines are taken
out. Count on it.
The CBOE Put-Call Ratio for
equities ($CPCE) stayed neutral at
1.04, as retail investors awake from
their lethargy. The pros relaxed a
little as $CPCI drifted to 1.04 at
the end of the day. The 10-day
average remains bearish at 1.38.
The NYSE Hi-Lo index closed up
29 points today to -69. The Hi-Lo
index remains in bearish territory.
SPY closed below its Head & Shoulders Neckline.
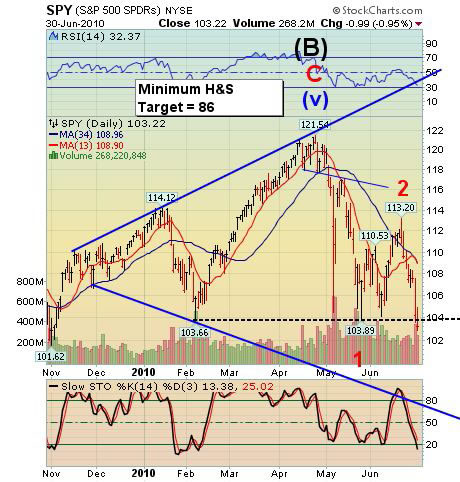 Action: Sell/Short/Inverse
-- Talking heads and many newsletter
writers are waking up today to a new
market as SPY closed below its
neckline. I still cannot figure out
why there was so much reluctance to
call it a bear market.
SPY didn’t cave below 104.00 until
3:00 pm when the big players took
the field. From that point forward,
volume spiked and selling began in
earnest.
Yesterday I suggested that, “The
mood in the market does not support
a rally at this time.” Now that the
end of quarter is behind us, we can
expect downside acceleration as
early as this overnight session.
QQQQ is heading for its own neckline.
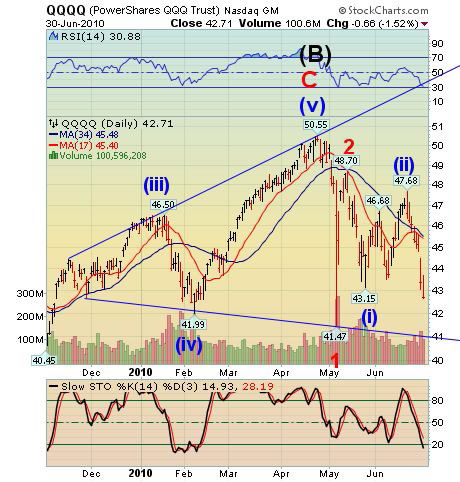 Action: Sell/Short/Inverse
-- QQQQ now has its own Head &
Shoulders neckline in sight. The
lower trendline of the Broadening
Top also has the ingredients for a
neckline of a large Head & Shoulders
pattern.
If the pattern is followed through, the
new target for this decline is 31.57.
By the way, the average decline once
the Broadening Top is violated is
also 31.57.
ICI reports the eighth consecutive
week of equity fund outflows. I
wonder why?
XLF is now at its neckline.
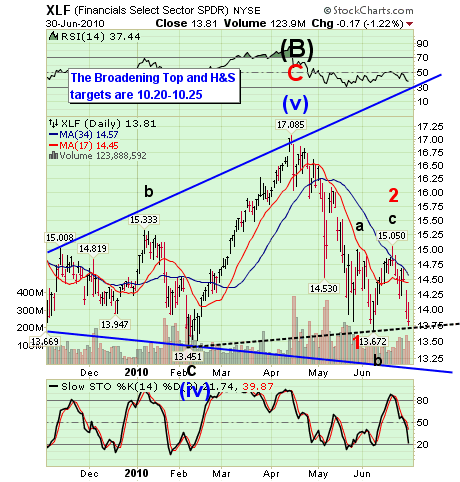 Action: Sell/Short/Inverse
-- XLF managed to close just above
its Head & Shoulders neckline today.
There is a good probability of taking
out the neckline tomorrow, which
leaves the lower trendline of the
Broadening Top formation. Not
surprisingly, both patterns have
identical targets.
FXI closed below intermediate-term Trend Support.
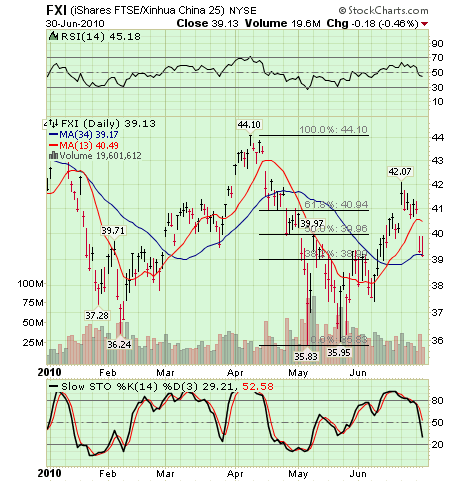 Action: Sell/Short/Inverse
-- FXI closed just below
intermediate-term Trend
Support/Resistance at 39.17. My
model now confirms a downtrend,
since all uptrend support has been
taken out. The retracement rally
from May 6th took an unusually long
period of time, which doesn’t leave a
lot of room for a decline by Monday,
its next potential Trading Cycle low.
Is China taking a turn for the worse?
$SSEC closed at 2398.37 in what
appears to be a bearish flag. The
giant triangle that I have been
following may have failed. I will
reassess the pattern sometime next
week.
GLD spends a second day at retracement levels.
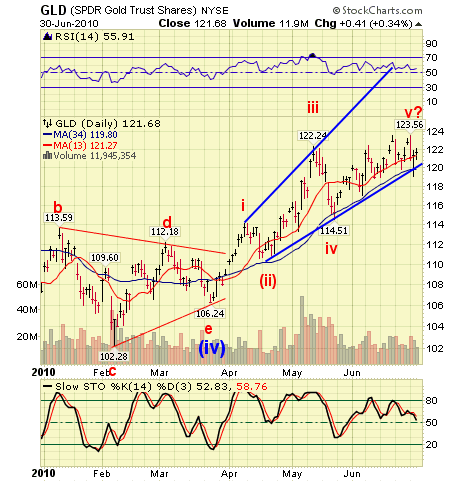 Action: Sell/Short/Inverse (partial)
-- GLD broke its intermediate-term
Trend Support at 119.79, then rallied
a second day, falling short of its
61.8% retracement level. I have a
high confidence pattern on the break
of the trendline, so my view hasn’t
changed.
I have recommended a partial short
position, since this is a Broadening
Formation and the pattern is not yet
certain. We will add more short
ETFs to our position when the share
price closes below 119.80.
USO broke below intermediate-term Support.
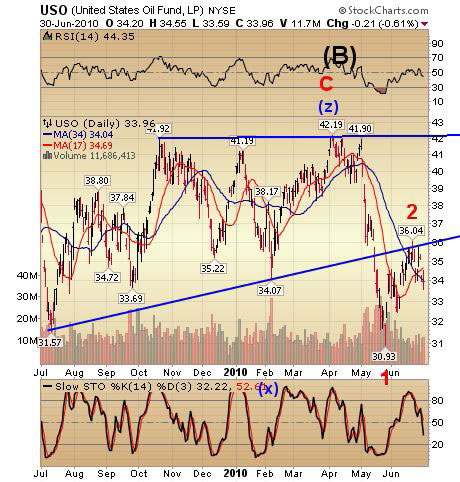 Action: Sell/Short/Inverse
-- USO broke and closed below
intermediate-term Trend
Support/Resistance at 34.04 today.
You may be surprised to hear that the
next target in USO is 18.00.
(Bloomberg) Hurricane Alex picked
up strength as it bore down on the
energy-rich region of southern Texas
and the western Gulf of Mexico,
closing oil and gas platforms and
ports from Corpus Christi, Texas, to
eastern Louisiana.
Still cautious on TLT.
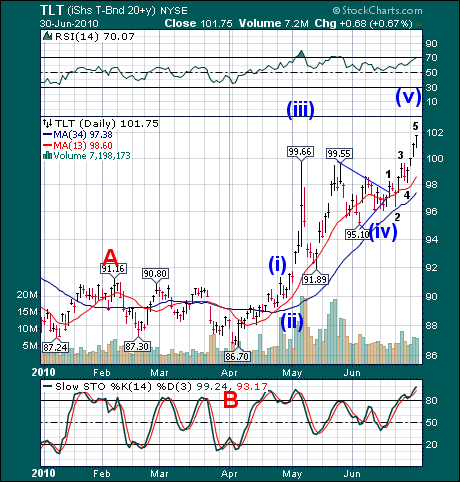 Action: Caution, no new positions
-- There are several ways with which
to view the pattern in TLT. All of
them say we are in a topping process.
Admittedly, it is still above its shortterm
Trend Support at 98.60. There
are arguably five waves up from the
end of the triangle formation, but the
last wave appears to be extending.
In addition, I am expecting a Primary
Cycle bottom in about two weeks.
The next pivot in TLT is on Friday.
UUP closed above short-term Trend Support.
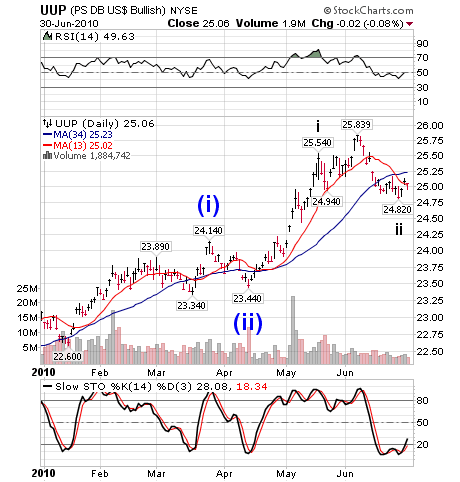 Action: Buy/Long
-- UUP slipped in early trading, but
managed to close above short-term
Trend Support/Resistance at 25.02
today. The action shows that a much
needed reversal pattern was put into
play today.
The action in UUP implies
something dramatic is about to
happen in the financial world. I am
clueless, so far, but we will know
when we see it.
Tony
Traders alert: The Practical Investor is currently offering the daily Inner Circle Newsletter to new subscribers. Contact us at tpi@thepracticalinvestor.com for a free sample newsletter and subscription information.
Our Investment Advisor Registration is on the Web
We are in the process of updating our website at www.thepracticalinvestor.com to have more information on our services. Log on and click on Advisor Registration to get more details.
If you are a client or wish to become one, please make an appointment to discuss our investment strategies by calling Connie or Tony at (517) 699-1554, ext 10 or 11. Or e-mail us at tpi@thepracticalinvestor.com .
Anthony M. Cherniawski, President and CIO http://www.thepracticalinvestor.com
As a State Registered Investment Advisor, The Practical Investor (TPI) manages private client investment portfolios using a proprietary investment strategy created by Chief Investment Officer Tony Cherniawski. Throughout 2000-01, when many investors felt the pain of double digit market losses, TPI successfully navigated the choppy investment waters, creating a profit for our private investment clients. With a focus on preserving assets and capitalizing on opportunities, TPI clients benefited greatly from the TPI strategies, allowing them to stay on track with their life goals
Disclaimer: The content in this article is written for educational and informational purposes only. There is no offer or recommendation to buy or sell any security and no information contained here should be interpreted or construed as investment advice. Do you own due diligence as the information in this article is the opinion of Anthony M. Cherniawski and subject to change without notice.
Anthony M. Cherniawski Archive |
© 2005-2022 http://www.MarketOracle.co.uk - The Market Oracle is a FREE Daily Financial Markets Analysis & Forecasting online publication.


