UK House Prices, Unemployment and Claimant Count Impact Trend Analysis
Housing-Market / UK Housing Jul 02, 2010 - 05:49 PM GMTBy: Nadeem_Walayat
 UK unemployment is set to rise as a consequence of deep spending cuts and tax rises that target an annual £113 billion withdrawal from the economy by 2015-16, which according to the ConLib governments own figures will result in 1.3 million job losses comprising of 600k public sector and 700k private sector jobs. This analysis seeks evaluate the likely impact of unemployment trends against house price trends.
UK Unemployment Forecast 2015-2015
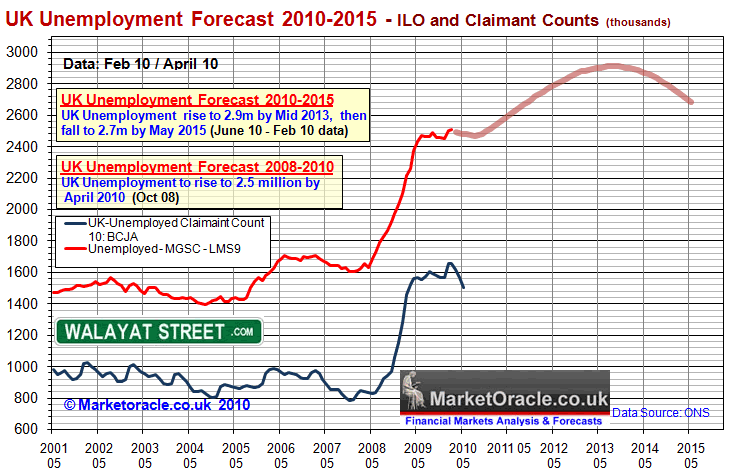
My recent in depth analysis (UK Unemployment Forecast 2010 to 2015) concluded in the following forecast for UK unemployment that followed the highly accurate forecast of October 2008 that targeted unemployment of approx 2.6 million by May 2010.
UK unemployment looks set to gradually rise to a peak of just over 2.9 million by mid 2013 before stabilising and starting to decline into a May 2015 General Election of just below 2.7 million against the governments forecast for UK unemployment to fall to 2 million by 2015 (OFBR - Peak at 8.1% this year before falling to 6.1%).
The benefit claimant count can also be expected to rise, though is much more difficult to forecast as it is far easier for the government to manage claimant numbers by moving recipients onto other benefits, OFBR forecast a claimant count of 1.17 million by May 2015.

UK House Prices Against Unemployment Trend Analysis

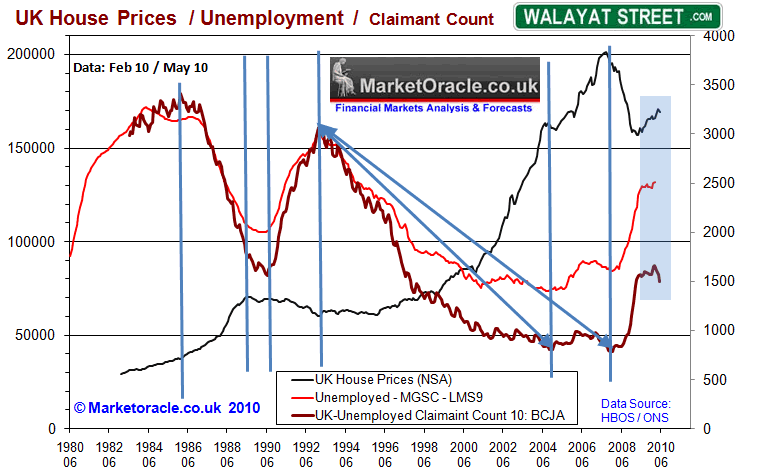
The above chart indicates that there does exist a strong relationship between house price trends and the unemployment benefit claimant count, more so than the unemployment data. The possible reason for this is that those made unemployed that do not claim benefits are not in as financially distressed state than those that have no choice but to claim benefits, therefore house prices can and have risen in the past whilst the official rate of unemployment rose, if at the same time the claimant count did not rise.
The bounce in house prices is tracking quite closely with the stabilisation of the claimant count numbers. My forecast is for UK unemployment to trend higher towards 2.9 million from 2.52 million over the next 3 years. The claimant count number is more difficult to gauge as it is easy for the government to manipulate by shifting claimants between benefits. Based on past behaviour claimant count will likely track rising unemployment, but show an earlier peak, which implies the following -
1. UK house prices will be under pressure for the next 2-3 years as a consequence of rising number of jobless / claimants.
2. That the actual trend in unemployment / claimant will be far milder than that during the economic depression of 2008-2010, which implies a slow down in the velocity of trend of the housing market with a downward bias.
3. claimant count is expected to stabilise before unemployment data probably by between late 2012 and early 2013, thereafter house prices can be expected to trend higher as claimant count numbers fall.
Therefore the conclusion of this analysis is that UK house prices will remain weak into early 2013 and then trend higher. It has yet to be determined if weak house prices means falling house prices in nominal terms, i.e. after inflation, the most probable conclusion from this segment of analysis is for stagnating house prices i.e. a sideways trend channel for the next 2.5 years.
This analysis is part of an on going series that will culminate in a multi-year UK house prices trend forecast by Mid August 2010 that will seek to more than replicate the original 2 year bear market forecast of August 2007 made right at the very peak of the UK housing market (22 Aug 2007 - UK Housing Market Crash of 2007 - 2008 and Steps to Protect Your Wealth ), which also builds up on the 100 page Inflation Mega-Trend Ebook of Jan 2010 (Free Download Now), which contained the following UK housing market analysis (updated graph):
UK Housing Bear Market Election Bounce
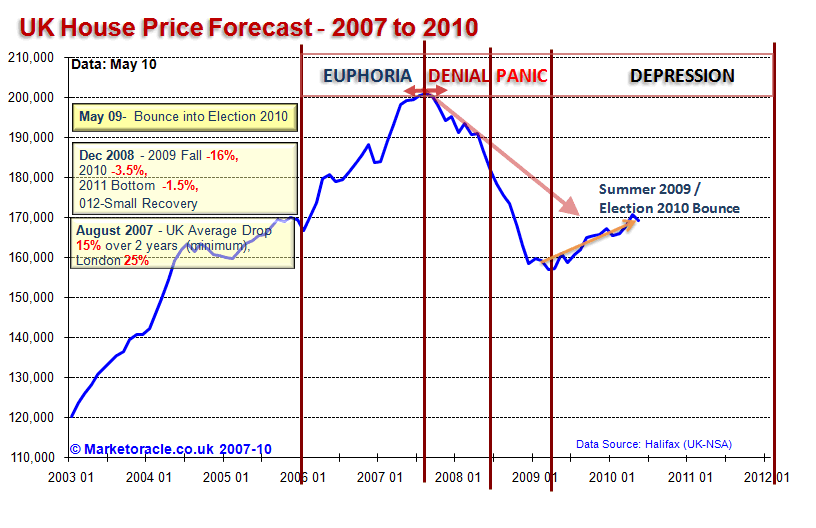
The UK housing market peaked in August 2007 and entered into a 2 year bear market exactly as forecast at the time (22 Aug 2007 - UK Housing Market Crash of 2007 - 2008 and Steps to Protect Your Wealth ), analysis which projected towards a fall in UK house prices from August 2007 to August 2009 of between 15% and 25% that has subsequently came to pass as UK house prices bottomed in March 2009 after having fallen by 23% from the 2007 peak.
The UK housing bear market has experienced a strong bounce off of the March 2009 lows and now stands up approx 10% off of the low as a consequence of unprecedented measures as mentioned in this ebook, the Labour government has succeeded in temporarily bringing UK house price falls to a halt and triggering an Election Bounce.
The impact of the inflation mega-trend on the UK housing market will be for UK house price to be supported in nominal terms, however this it does NOT ignite the feel good factor that triggers housing market booms which only follow when house prices begin to significantly rise in REAL terms i.e. after inflation.

Whilst the current corrective bounce looks set continue into the middle of 2010 (allowing for a potential one month blip as a consequence of the bad January weather), this rally is still seen as a correction within a housing bear market that is expected to remain in a depression for many years, before house prices succumb to the effect of the inflation mega-trend and start to rise.
Ensure you are subscribed to my always free newsletter to receive key in depth analysis and forecasts in your email in box on an ongoing basis.
Source: http://www.marketoracle.co.uk/Article20783.html
By Nadeem Walayat
Copyright © 2005-10 Marketoracle.co.uk (Market Oracle Ltd). All rights reserved.
 Nadeem Walayat has over 20 years experience of trading derivatives, portfolio management and analysing the financial markets, including one of few who both anticipated and Beat the 1987 Crash. Nadeem's forward looking analysis specialises on UK inflation, economy, interest rates and the housing market and he is the author of the NEW Inflation Mega-Trend ebook that can be downloaded for Free. Nadeem is the Editor of The Market Oracle, a FREE Daily Financial Markets Analysis & Forecasting online publication. We present in-depth analysis from over 500 experienced analysts on a range of views of the probable direction of the financial markets. Thus enabling our readers to arrive at an informed opinion on future market direction. http://www.marketoracle.co.uk
Disclaimer: The above is a matter of opinion provided for general information purposes only and is not intended as investment advice. Information and analysis above are derived from sources and utilising methods believed to be reliable, but we cannot accept responsibility for any trading losses you may incur as a result of this analysis. Individuals should consult with their personal financial advisors before engaging in any trading activities.
Nadeem Walayat Archive |
© 2005-2022 http://www.MarketOracle.co.uk - The Market Oracle is a FREE Daily Financial Markets Analysis & Forecasting online publication.


