


Stock Market Retests H&S Neckline, Perfect Setup for Opening Gap Down
Stock-Markets / Stock Markets 2010 Jul 07, 2010 - 03:26 AM GMT

 U.S. stocks gained, with the Standard & Poor’s 500 Index rising from a 10-month low, amid
speculation earnings growth will help equities rebound from their lowest valuations since the
bull market began in 2009. (LOL!)
U.S. stocks gained, with the Standard & Poor’s 500 Index rising from a 10-month low, amid
speculation earnings growth will help equities rebound from their lowest valuations since the
bull market began in 2009. (LOL!)
The S&P 500 climbed 0.5 percent to 1,028.06 at 4 p.m. in New York after jumping 2 percent in the first hour of trading. The Dow Jones Industrial Average gained 57.14 points, or 0.6 percent, to 9,743.62 to snap a seven-day losing streak, its longest since the financial crisis in 2008.
Cleveland Fed on GDP - Dreary Outlook
(ZeroHedge) The Cleveland Fed issued a report that looked at the historical relationship between lagged GDP growth and the steepness of the yield curve. They compared the ten-year with the three-month bill yield. They used this information to make a probability estimate for a double did recession. Not surprisingly, they concluded that the probability is only 10%. I would take that bet. If anyone in Cleveland is interested, let me know.
99 Stocks Account For Half Of Day's Trading Volume As Liquidity Concentrates In Ever Fewer Stocks
(ZeroHedge) The attached liquidity analysis by Abel-Noser indicates that the US stock market has now become a concentrated pool in which just the top 99 stocks account for 50.09% of total domestic trading volume. In June, the top 20 stocks accounted for 28.94% of all domestic volume, an increase of 2.2% over May's 26.7% and a record. The HFT algos are increasingly trading less and less stocks in their attempt to corner just the most liquid stocks. Indicatively, the top 978 names represented 90.01% of total domestic volume, while the remaining 17,597 accounted for just 10% of all dollars traded.
VIX tested short-term Support, makes a right shoulder.
 -- VIX tested short-term Trend
Support at 28.95 as I had speculated
last Thursday and completed a right
shoulder of an inverted Head &
Shoulders pattern. Today is
considered the last day of the
positive seasonal influences. What
follows is what is considered the four
worst months of the year in the stock
market.
The CBOE Put-Call Ratio for
equities ($CPCE) rose to .99, as
retail investors didn’t like what
they saw. The pros became more
bearish as $CPCI rose to 1.64 at
the end of the day. The 10-day
average remains bearish at 1.51.
The NYSE Hi-Lo index closed up 3
points today to -41. The Hi-Lo
index remains at a low ebb, but
could become extreme.
-- VIX tested short-term Trend
Support at 28.95 as I had speculated
last Thursday and completed a right
shoulder of an inverted Head &
Shoulders pattern. Today is
considered the last day of the
positive seasonal influences. What
follows is what is considered the four
worst months of the year in the stock
market.
The CBOE Put-Call Ratio for
equities ($CPCE) rose to .99, as
retail investors didn’t like what
they saw. The pros became more
bearish as $CPCI rose to 1.64 at
the end of the day. The 10-day
average remains bearish at 1.51.
The NYSE Hi-Lo index closed up 3
points today to -41. The Hi-Lo
index remains at a low ebb, but
could become extreme.
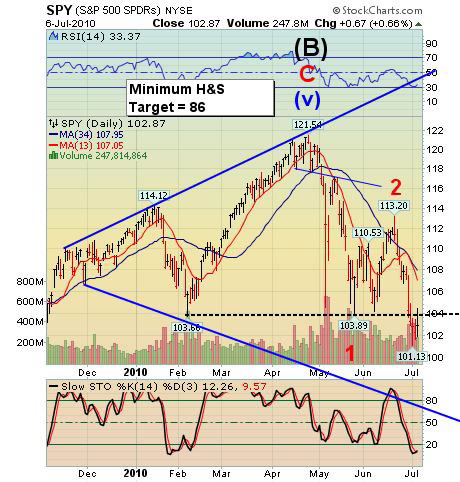
SPY attempted a retest of its Head & Shoulders Neckline.
 Action: Sell/Short/Inverse
-- Today SPY attempted to retest the
H & S Neckline at 104.00. While it
temporarily overshot to 104.37, there
was too much selling pressure at
104.00. This constituted a 26.26%
retracement of the last two weeks’
decline. Tomorrow is a pivot day
and SPY (all equities, in fact) have a
perfect setup for a gap down at the
open tomorrow to kick off its third
wave.
I recall my trading activity in 2002,
where I was surprised by a 3.77%
rally on July 5th. It put me off my
game for a couple of days as I was
trying to figure out where it came
from. Probably end-of-quarter
retirement plan contributions.
Action: Sell/Short/Inverse
-- Today SPY attempted to retest the
H & S Neckline at 104.00. While it
temporarily overshot to 104.37, there
was too much selling pressure at
104.00. This constituted a 26.26%
retracement of the last two weeks’
decline. Tomorrow is a pivot day
and SPY (all equities, in fact) have a
perfect setup for a gap down at the
open tomorrow to kick off its third
wave.
I recall my trading activity in 2002,
where I was surprised by a 3.77%
rally on July 5th. It put me off my
game for a couple of days as I was
trying to figure out where it came
from. Probably end-of-quarter
retirement plan contributions.
QQQQ is heading for its own neckline.
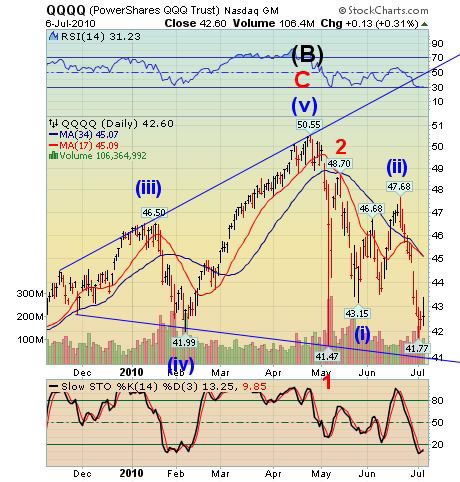 Action: Sell/Short/Inverse
-- QQQQ completed a 27%
retracement today as it prepares to
challenge its Head & Shoulders
neckline at 41.00. It is also the lower
trendline of the Broadening Top. A
down-sloping neckline has higher
probabilities for success and portends
a larger decline, according to Thomas
Bulkowski’s Encyclopedia of Chart
Patterns (p. 290).
If the pattern is followed through, the
new target for this decline is 31.57.
By the way, the average decline once
the Broadening Top is violated is also
31.57. The NDX attempted but did
not succeed in retracing to its
neckline at 1775 today.
Action: Sell/Short/Inverse
-- QQQQ completed a 27%
retracement today as it prepares to
challenge its Head & Shoulders
neckline at 41.00. It is also the lower
trendline of the Broadening Top. A
down-sloping neckline has higher
probabilities for success and portends
a larger decline, according to Thomas
Bulkowski’s Encyclopedia of Chart
Patterns (p. 290).
If the pattern is followed through, the
new target for this decline is 31.57.
By the way, the average decline once
the Broadening Top is violated is also
31.57. The NDX attempted but did
not succeed in retracing to its
neckline at 1775 today.
XLF made a second retest of its neckline.
 Action: Sell/Short/Inverse
-- XLF made a 32% retracement as it
retested its Head & Shoulders
neckline today. The next target is the
lower trendline of the Broadening
Top formation (in all likelihood)
tomorrow.
Action: Sell/Short/Inverse
-- XLF made a 32% retracement as it
retested its Head & Shoulders
neckline today. The next target is the
lower trendline of the Broadening
Top formation (in all likelihood)
tomorrow.
FXI retraced 52% to hit short-term Trend Support.
 Action: Neutral
-- FXI retraced 52.65% of its two
week decline to its short-term Trend
Resistance at 40.28. This is the best
retracement of all the ETFs I follow.
Yesterday was its Trading Cycle low,
so if it can manage to overcome
short-term Trend Resistance, it is
bullish. Otherwise, I await a
breakdown below intermediate-term
Trend Support to become bearish.
$SSEC closed at 2409.42, nearly 100
points off its low. It also pivoted on
Monday, so I remain stuck on the
giant triangle that I have been
following for some time. It poses a
dilemma, since there is nothing but
bad news coming out of China.
Action: Neutral
-- FXI retraced 52.65% of its two
week decline to its short-term Trend
Resistance at 40.28. This is the best
retracement of all the ETFs I follow.
Yesterday was its Trading Cycle low,
so if it can manage to overcome
short-term Trend Resistance, it is
bullish. Otherwise, I await a
breakdown below intermediate-term
Trend Support to become bearish.
$SSEC closed at 2409.42, nearly 100
points off its low. It also pivoted on
Monday, so I remain stuck on the
giant triangle that I have been
following for some time. It poses a
dilemma, since there is nothing but
bad news coming out of China.
GLD may be ready for a brief retracement.
 Action: Sell/Short/Inverse
-- GLD completed an impulse in the
daily chart and may be ready for a
brief retracement. Current overhead
resistance is at 117.40 and 118.86.
The 38.2% retracement is at 119.07.
I do not have any confidence in a
strong retracement, although it could
happen. What I do have confidence
in is that GLD has now joined
equities in what may also be a crash
pattern in GLD.
I do not envision a retest of the
Broadening Wedge trendline at this
time. The retest rate of a
Broadening Wedge is only 21%.
Action: Sell/Short/Inverse
-- GLD completed an impulse in the
daily chart and may be ready for a
brief retracement. Current overhead
resistance is at 117.40 and 118.86.
The 38.2% retracement is at 119.07.
I do not have any confidence in a
strong retracement, although it could
happen. What I do have confidence
in is that GLD has now joined
equities in what may also be a crash
pattern in GLD.
I do not envision a retest of the
Broadening Wedge trendline at this
time. The retest rate of a
Broadening Wedge is only 21%.
USO broke below intermediate-term Support.
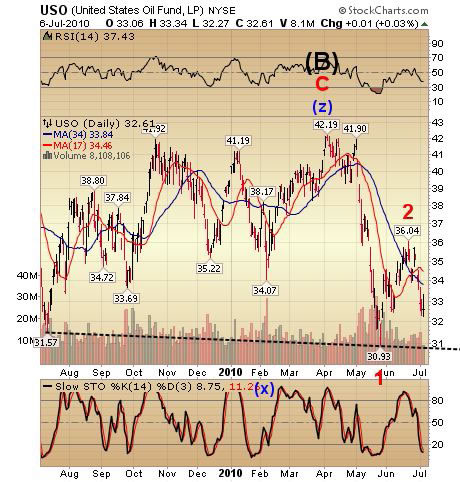 Action: Sell/Short/Inverse
-- USO made a 27.8% retracement of
its decline from 36.04, then gave up
most of its gains. Although USO is
very oversold, it can remain in that
condition during the entire duration
of its third wave. That is why many
trading blogs are still looking for a
rally, since they follow
overbought/oversold indicators,
which currently suggest a reversal.
The cycles suggest otherwise.
I have drawn in the neckline for a
complex, triple-headed Head and
Shoulders pattern. Once below 30.93
the minimum downside target is
19.67, while another calculation
suggests as low as 17.80.
Action: Sell/Short/Inverse
-- USO made a 27.8% retracement of
its decline from 36.04, then gave up
most of its gains. Although USO is
very oversold, it can remain in that
condition during the entire duration
of its third wave. That is why many
trading blogs are still looking for a
rally, since they follow
overbought/oversold indicators,
which currently suggest a reversal.
The cycles suggest otherwise.
I have drawn in the neckline for a
complex, triple-headed Head and
Shoulders pattern. Once below 30.93
the minimum downside target is
19.67, while another calculation
suggests as low as 17.80.
The reversal pattern in TLT looks ominous.
 Action: Sell/Short/Inverse
-- Last Thursday I reported a
reversal pattern in the hourly TLT
chart. Today the reversal pattern
appears in the daily chart. This
constitutes the best place for taking
profits in an ending pattern.
Friday’s pivot gave us the initial
decline. The follow-on decline may
take TLT as low as its intermediateterm
Trend Support at 97.77.
In addition, I am expecting a
Primary Cycle bottom by the end of
this week, which implies that all
cycle supports may be broken by
then. See ZeroHedge article.
Action: Sell/Short/Inverse
-- Last Thursday I reported a
reversal pattern in the hourly TLT
chart. Today the reversal pattern
appears in the daily chart. This
constitutes the best place for taking
profits in an ending pattern.
Friday’s pivot gave us the initial
decline. The follow-on decline may
take TLT as low as its intermediateterm
Trend Support at 97.77.
In addition, I am expecting a
Primary Cycle bottom by the end of
this week, which implies that all
cycle supports may be broken by
then. See ZeroHedge article.
UUP is ready to pivot.
 Action: Buy/Long
-- Tomorrow is a pivot day for UUP
as it settled on its 38.2% Fibonacci
retracement today. Today’s action
may give us a new seasonal cycle,
since this one has lasted since
November 25, 2009. This has been
an unusually long cycle, but the
dollar seems to be the only asset left
in rally mode.
The pivot in UUP implies the
beginning of a third wave higher
while equities, bonds and
commodities go much lower.
Action: Buy/Long
-- Tomorrow is a pivot day for UUP
as it settled on its 38.2% Fibonacci
retracement today. Today’s action
may give us a new seasonal cycle,
since this one has lasted since
November 25, 2009. This has been
an unusually long cycle, but the
dollar seems to be the only asset left
in rally mode.
The pivot in UUP implies the
beginning of a third wave higher
while equities, bonds and
commodities go much lower.
Tony
Traders alert: The Practical Investor is currently offering the daily Inner Circle Newsletter to new subscribers. Contact us at tpi@thepracticalinvestor.com for a free sample newsletter and subscription information.
Our Investment Advisor Registration is on the Web
We are in the process of updating our website at www.thepracticalinvestor.com to have more information on our services. Log on and click on Advisor Registration to get more details.
If you are a client or wish to become one, please make an appointment to discuss our investment strategies by calling Connie or Tony at (517) 699-1554, ext 10 or 11. Or e-mail us at tpi@thepracticalinvestor.com .
Anthony M. Cherniawski, President and CIO http://www.thepracticalinvestor.com
As a State Registered Investment Advisor, The Practical Investor (TPI) manages private client investment portfolios using a proprietary investment strategy created by Chief Investment Officer Tony Cherniawski. Throughout 2000-01, when many investors felt the pain of double digit market losses, TPI successfully navigated the choppy investment waters, creating a profit for our private investment clients. With a focus on preserving assets and capitalizing on opportunities, TPI clients benefited greatly from the TPI strategies, allowing them to stay on track with their life goals
Disclaimer: The content in this article is written for educational and informational purposes only. There is no offer or recommendation to buy or sell any security and no information contained here should be interpreted or construed as investment advice. Do you own due diligence as the information in this article is the opinion of Anthony M. Cherniawski and subject to change without notice.
Anthony M. Cherniawski Archive |
© 2005-2022 http://www.MarketOracle.co.uk - The Market Oracle is a FREE Daily Financial Markets Analysis & Forecasting online publication.