


Gold Seasonality – Time to Buy?
Commodities / Gold and Silver 2010 Jul 09, 2010 - 02:35 AM GMTBy: Jason_Hamlin

 In statistics, many time series exhibit cyclic variation known as seasonality. In my market research days, seasonality was a very important and accurate predictive indicator for my clients. This data was used to determine production, inventory, sales forecasts and strategically to determine the best times to promote products or offer price discounts.
In the precious metals market, understanding seasonality can help investors know when to buy and sell at optimal prices. Analysts often mention gold’s seasonality and refer to the “Summer doldrums” as a buying opportunity and the Winter months as the high season. To verify gold’s seasonality and identify opportunities to profit from the trends, I decided to compile the data and create some simple yet insightful charts.
First, let’s take a look at gold’s price indexed across the various months of the year. 100 is the baseline or average monthly price for the year. A reading of 110 would indicate the price is 10% above baseline and an index of 90 would indicate the gold price is 10% below baseline.
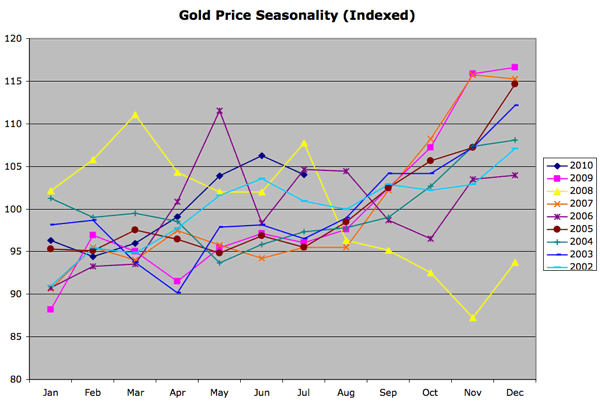
The striking trend in this chart is the upward trajectory of the index from the beginning of the year to the end of the year. This occurred in every calendar year except 2008 (yellow line), when the financial crisis created a dash for cash and liquidation across all investments. Other than this outlier, we can see that the gold price is typically 5-10% below average during the first few months of the year and 5-15% above average during the last few months of the year.
The only problem with this chart is that gold is in a secular bull market that is steadily advancing every month. Thus, part of the reason for the higher index readings during the later months is simply because they are more recent in time. So I decided to slice the data another way and take a look at percentage change versus the previous month. This gives us a more recent and relevant baseline to use in evaluating gold’s seasonality. The following chart averages the monthly change (versus previous month) over the past 10 years.
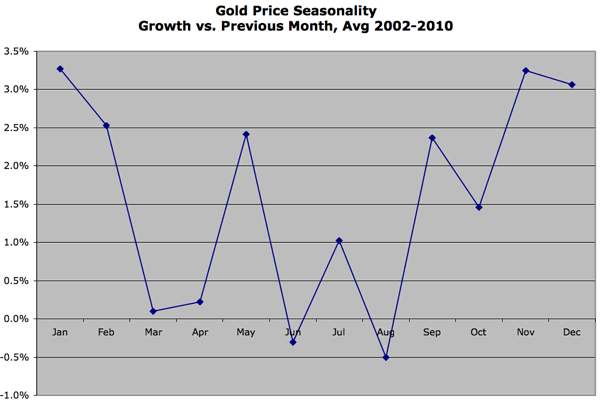
The above chart shows that gold only has two months with a negative average gain, with -0.5% being the worst month during August. This reinforces just how strong the gold bull market has been, given that only two months show losses and those losses are tiny compared to the gains in other months. The highest monthly gains all occur during the Winter months (November – February) and the slowest growth occurs in the Spring/Summer months (March – August).
The data table for the above chart can be found below. It shows a few outliers such as the May 2006 growth of 10.6%, which explains the May spike that occurs in the middle of the slow growth season. Similarly, the -11.8% drop in June of 2006 is responsible for what would otherwise be a very strong month for gold. In fact, removing this outlier leaves June with average growth of 1.1%.
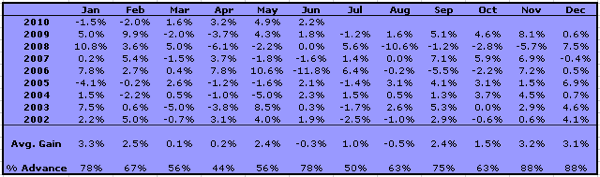
I also added a row showing what percentage of the time gold advances in a given month. Further testament to the potency of the current bull market is the fact that April is the only month where gold has declined more often than it has advanced over the past ten years. November, December and January not only have the largest percentage gains, but are also the months when gold advances most often. In fact, gold advances 88% of the time during November and December, with the only declines occurring during the 2008 financial crash.
Bottom Line
Investors looking to buy the dips are most likely to have success during the Spring/Summer months of March, April, May, July and August. Please note that June is left out of this sequence because the price actually advances 78% of the time, despite the negative average growth. Short-term traders should look to buy during these months and sell during February of each year. Regardless of your investment horizon, this data demonstrates the robustness of the bull market in precious metals. 10 out of 12 months produce positive gains and only one month, April, has a history of declining more often than it advances.
As we move into mid-July and August, it is the perfect season to load up on physical gold and silver, as well as shares of quality mining stocks. If this Winter follows previous years (2008 excepted), you should be racking up considerable profits by Spring of 2011. The trend is your friend.
By Jason HamlinGold Stock Bull Premium Membership - If you would like to receive my monthly contrarian newsletter, view the Gold Stock Bull portfolio and receive email alerts whenever I am buying or selling, become a premium member today. You can try it out monthly at just $35 and cancel at anytime if you aren’t 100% satisfied. View the video introduction for more details or click here to get started now!
All ideas, opinions, and/or forecasts, expressed or implied herein, are for informational purposes only and should not be construed as a recommendation to invest, trade, and/or speculate in the markets. Any investments, trades, and/or speculations made in light of the ideas, opinions, and/or forecasts, expressed or implied herein, are committed at your own risk, financial or otherwise. The information on this site has been prepared without regard to any particular investor’s investment objectives, financial situation, and needs. Accordingly, investors should not act on any information on this site without obtaining specific advice from their financial advisor. Past performance is no guarantee of future results.
© 2005-2022 http://www.MarketOracle.co.uk - The Market Oracle is a FREE Daily Financial Markets Analysis & Forecasting online publication.