


Shanghai NOT Leading S&P-500: But it’s going in a Different Direction
Stock-Markets / Stock Markets 2010 Jul 11, 2010 - 04:20 PM GMTBy: Andrew_Butter

 Had a few articles out recently saying that the Shanghai Stock Exchange is (perhaps) a leading indicator of the S&P 500:
http://www.marketoracle.co.uk/Article20973.html
http://seekingalpha.com/..
Depends on how you squint and what scales you transpose; here’s another way of looking at it:
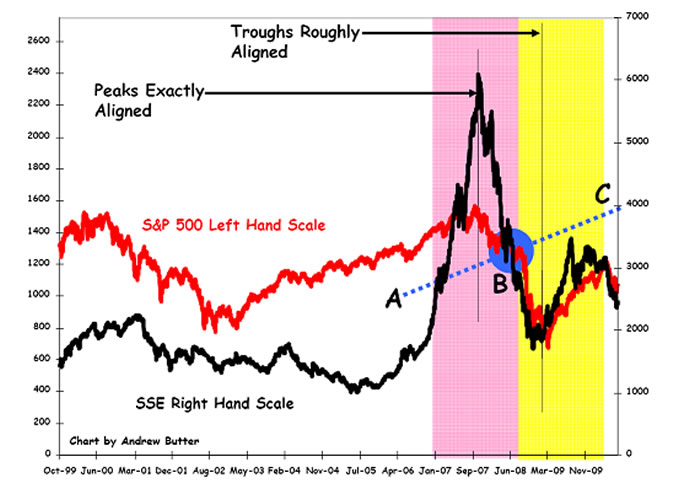
I suppose I might have astigmatism but even if I turn my head sideways, that distinctly looks like the Big Bubble of the SSE popped at the same time what I call the secondary pop up the S&P-500 bubble popped (my idea is that was a two-part pop that was initiated in June 2000 but delayed and restructured into housing in part thanks to the noble efforts of The Right Honourable Sir Alan Greenspan).
My theory for what it’s worth is that the SSE bubble was a clean simple one-time bubble of 18 months and that it should have got back to it’s fundamental (whatever that is) by now.
The “theory” also is that you can roughly work out the fundamental on a short bubble by taking the square root of the peak X the trough (that’s the blue blob (B)).
The conundrum is the slope of the fundamental line (roughly sketched A-B-C), which ought to track nominal GDP divided by the effective yield, although since borrowing in China is not transparent (and they don’t sell treasuries), and since also the SSE does not represent China as a whole very adequately, that’s a hard call.
S&P 500 is easier, if you believe in the idea that it was a double-pop down to about 675 (which was predicted by this logic in February 2009 and I suppose that provides some element of validation (http://www.marketoracle.co.uk/Article9131.html), followed by a bounce that, again according to the theory would stall at about 1200 (http://www.marketoracle.co.uk/Article10604.html), which seems to have been about right.
With the future likely to be more or less dictated by the change in nominal GDP (likely to be fairly anaemic), divided by the 30-Year Treasury yield (likely to stay pretty low unless the “hyper-inflationists” who have been banging their drums for the past eighteen months, get their way (which in my opinion is unlikely until the Private Sector in USA can be persuaded to borrow and spend again (http://www.marketoracle.co.uk/Article20418.html).
The caveat of course is that 50% of S&P earnings are outside of USA which makes things more complicated.
The SSE on the other hand is running free – its past’s its post-bubble hangover, and unless the Chinese economy stalls, I still suspect that the only way is up.
The caveat on that of course is that’s what I said in January 2010, and look what happened (26% down)…timing of course is everything in the forecasting business.
By Andrew Butter
Twenty years doing market analysis and valuations for investors in the Middle East, USA, and Europe; currently writing a book about BubbleOmics. Andrew Butter is managing partner of ABMC, an investment advisory firm, based in Dubai ( hbutter@eim.ae ), that he setup in 1999, and is has been involved advising on large scale real estate investments, mainly in Dubai.
© 2010 Copyright Andrew Butter- All Rights Reserved
Disclaimer: The above is a matter of opinion provided for general information purposes only and is not intended as investment advice. Information and analysis above are derived from sources and utilising methods believed to be reliable, but we cannot accept responsibility for any losses you may incur as a result of this analysis. Individuals should consult with their personal financial advisors.
Andrew Butter Archive |
© 2005-2022 http://www.MarketOracle.co.uk - The Market Oracle is a FREE Daily Financial Markets Analysis & Forecasting online publication.
Comments
|
dincer
12 Jul 10, 05:24 |
Have A Look At $SSEC:$USD
I think $SSEC:$USD chart provides a healthier comparison and analysis. |