


How Long Can this Stock Market Rally Last, Must-See Chart Has the Answer
Stock-Markets / Stock Markets 2010 Jul 16, 2010 - 01:59 PM GMTBy: Q1_Publishing

 Andrew Mickey writes: “When masses of people succumb to an idea, they often run off a tangent because of their emotions.”
That’s what the Humphrey Neill wrote in his 50-year-old book, The Art of Contrary Thinking.
It describes perfectly what’s going on today.
Bad news surrounded us for weeks. The summer doldrums have sunk the S&P 500 by 15%. China’s manufacturing activity growth has fallen sharply. “Depression” was making it back into the headlines. Tax hikes looming on the horizon were a very real concern for everyone. It was looking so bad the Fed even signaled it was eyeing kicking off another round of quantitative easing (a.k.a. printing money).
The masses took it all in and were running off on a tangent too. The increase in Closed-End Fund (CEF) discounts we looked at last week, one of the best sentiment indicators, showed market is really starting to price in a lot of the worst-case scenario.
Since then, the markets have made a sharp turnaround. The “fix” is in. It’s earning fantasy season and companies are posting average earnings. In most cases they’re not as bad as expected. Which means to some - buy, buy, buy.
Right now though with the herd solidly on the euphoria tangent, investors should be asking, “How long will it last?”
The chart below shows the answer may surprise you.
Getting Technical
Through many years of experience we’ve learned to be highly suspicious of charts and black box trading systems.
There are, however, some technical indicators that are very important if only because so many people follow them. One of those is the 200-day moving average.
The chart below, which tracks the percentage of S&P 500 components trading above their 200-day moving average, shows the downtrend could have made a sharp reversal:
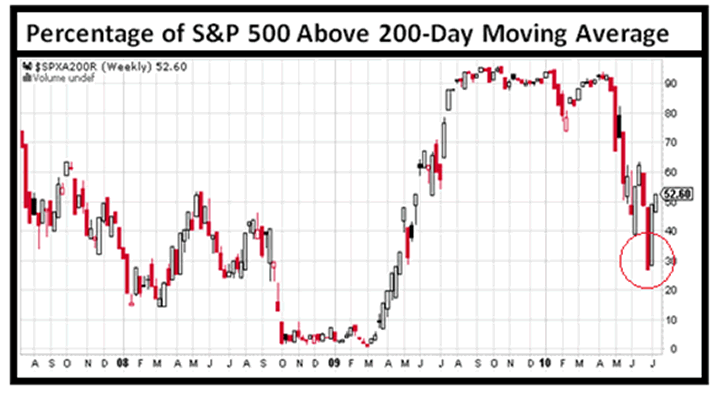
Since the markets turned around, the number of S&P components trading above their critical 200-day moving averages has surged to 52% from a low of 26%.
It’s a critical turn because when stocks are below their 200-day moving average, they tend to go down. Just look at what happened since the start of the bear market of 2007 to 2009. Stocks were below their 200-day moving average almost the entire time. Then the March 2009 rally started and pushed stocks above the critical 50% level and the rally lasted longer than almost everyone anticipated.
That’s why, if the markets hold on for a few more days, we could be in for another sustained multi-month rally.
If It Bleeds, It Leads
Of course, there is no way to predict the short-term market movement with absolute certainty. We know enough to know we don’t know anything about the short-term. But we can get in position for what’s likely to happen. This indicator will help us do that.
As part of our “L-shaped” recession expectation, we expect the markets to remain very volatile. It’s easy to expect a stock market which moves up and down 10% to 20% every few months as the economy dips into and out of recession.
So if we don’t see a sustained period where most stocks are above their 200-day moving averages, it’s a pretty safe bet the market’s next move is down. Remember the old newspaper adage, “If it bleeds, it leads” and the vicious cycle of bad news begetting more bad news can really feed on itself during period of high uncertainty.
That’s why now is a great time to review your positions, ensure you have enough cash on hand to take advantage of the opportunities when they come (being 20% or more in cash is certainly reasonable in this type of environment), and continue to look for the high-reward/low-risk opportunities.
So although the masses are succumbing to the idea of great earnings and are happy to take a break from the bearishness, we don’t feel it will last too long. But the great indicators like the S&P 500 stocks relative to 200-day moving averages, we won’t have to rely on feel and be able to take what the market gives us.
Good investing,
Andrew Mickey
Chief Investment Strategist, Q1 Publishing
Disclosure: Author currently holds a long position in Silvercorp Metals (SVM), physical silver, and no position in any of the other companies mentioned.
Q1 Publishing is committed to providing investors with well-researched, level-headed, no-nonsense, analysis and investment advice that will allow you to secure enduring wealth and independence.
© 2010 Copyright Q1 Publishing - All Rights Reserved
Disclaimer: The above is a matter of opinion provided for general information purposes only and is not intended as investment advice. Information and analysis above are derived from sources and utilising methods believed to be reliable, but we cannot accept responsibility for any losses you may incur as a result of this analysis. Individuals should consult with their personal financial advisors.
© 2005-2022 http://www.MarketOracle.co.uk - The Market Oracle is a FREE Daily Financial Markets Analysis & Forecasting online publication.