


Stock Market Targeting Corrective Downtrend Into October
Stock-Markets / Stock Markets 2010 Jul 19, 2010 - 01:52 AM GMTBy: Andre_Gratian

 Current Position of the Market
Very Long-term trend - Down! The very-long-term cycles are down and if they make their lows when expected, the bear market which started in October 2007 should continue until about 2014-2015.
SPX: Intermediate trend. The index made an intermediate top at 1220 and is now in a dubious intermediate downtrend.
Analysis of the short-term trend is done on a daily basis with the help of hourly charts. It is an important adjunct to the analysis of daily and weekly charts which discusses the course of longer market trends.
Overview:
In the past two weeks, indices attempted to reverse their intermediate downtrend, but failed. As we will see on the following charts, the rally met with severe resistance near the 1100 area and, with the help of bottoming cycles, a sharp reversal took place on Friday. Since, ideally, the cycle immediately responsible for the wealmess is likely to make its low on Monday, there could be a little follow through to the decline, but the hourly indicators are already poised for a near-term reversal, so it would not be surprising if we turned around in the next couple of days.
It is not yet clear if a reversal of the SPX in the next day or so will signify an immediate continuation of the rally which started at 1011. There are more cycles making their lows in the next couple of weeks (Aren't there always?). It's a question of whether the 2-yr cycle which ignited the rally on 7/01 will be able to contain all the short-term corrections and continue its upward push until it is finally overcome by the larger 4-year cycle, probably sometime in mid to late August.
If the rally is extended after a short pull-back, it is likely that, on the next attempt, the intermediate downchannel will be penetrated on the up-side, and this will put an end to a relatively short intermediate period. The longer-term uptrend which started in March 2009 is still in effect, and the current decline from 1022 is probably only part of a corrective pattern that will end in October. After this, the bull market should continue until some time in 2011 when it will finally be offset by the very long-term cycles due to bottom in 2014-15. Although I offered a potential alternate scenario in the last newsletter two weeks ago, this is still my preferred one. We should be able to confirm one or the other by October.
Analysis
Chart Pattern and Momentum
We have not reviewed the Weekly Chart for a while, so let's start with that one.
The blue intermediate channel which denoted the uptrend from the 2009 low was broken shortly after the index reached 1222 -- the approximate projection derived from the H&S pattern that marked an end to the bear market from October 2007 -- and the SPX is now in an intermediate downtrend which is outlined in red. This is only an approximation, and it may have to be adjusted as we move forward.
The longer term trend is represented by the green channel. The decline from 1222 came to an end -- perhaps only temporarily -- when it retraced about .618 of the channel width. Until that channel is decisively penetrated to the downside, we are still in a bull market.
Note that the bottom indicators did not show any divergence when the index made its low 2 weeks ago. This could mean that the rally will be limited in strength. There was some deceleration evident when the early July prices failed to go all the way to the channel bottom, and positive divergence did show on most of the daily indicators at that time.
With the 2-yr cycle low approaching, we knew that we were close to a reversal. Now that it has reversed, it will be the main driver for a while, and it is likely that in spite of Friday's big sell-off, the index is only correcting its short-term overbought condition before moving higher. There may still be a 77-78-wk cycle bottoming directly ahead which could prolong the consolidation by another week or two, but it is not a cycle with which I am familiar enough to state positively that it will have a significant influence on the market, and this is why I have placed it on the chart with a question mark. I am much more confident that the nest of cycles around the 4-yr will produce a low in October.
The rally stopped at the level of the 40-wk MA, which is the weekly replica of the 200-day (40X5=200). On the next attempt at going up it will have to be overcome if we are to put an end to the current intermediate downtrend.
One more thing to note is that the decline essentially ended in the vicinity of the mid-channel line and that the index is now trying to get back above it.
Let's move on to the
Daily Chart.
The rally which started on 7/2 was preceded by the divergence which was showing in two of the three indicators. There was no such (negative) divergence showing in the momentum indicators at Friday's top, but there was a slight warning given by the A/D oscillator at the bottom. What stopped the rally was a strong resistance area formed primarily by the combined 200-DMA and the 50-DMA.
The reversal itself was primarily the work of a short-term cycle which should bottom on Monday. It's still not clear how much more consolidation will be needed and how much of an effect the reversing cycle will immediately have on the market. The indicators are still in a basic uptrend -- as is illustrated -- and it will have to deteriorate further to signal that we have made a significant top and are resuming the downtrend.
Next, on the Hourly Chart, we can see that the hourly indicators are oversold and should soon be ready to turn up. When they show some positive divergence, it will mean that the turn is imminent. I have a tentative projection for the low to form at about 1052-1055 (maximum 1044). This is based on Fibonacci and P&F measurements. I have also drawn a tentative channel to represent the downtrend, but it may have to be adjusted after Monday's activity. Moving above the various MAs and the top of the channel would mean that the correction is over, unless other cycles directly ahead force a sideways movement before the SPX can attempt to extend its uptrend.
Cycles
The current bull market is driven by the 7-yr and 6-yr cycles (see weekly chart).
The 2-yr cycle has made its low and is the primary force behind the rally which started at 1011. It can be an important cycle which could push prices much higher, but its upward strength will be mitigated by the 4-yr cycle which is now only about three or four months from bottoming.
Friday's sell-off was caused by the 16-wk cycle which is scheduled to bottom on Monday.
There is a possibility that a 77-78-week cycle, tentatively slated to make its low in the next week or two, will have some effect on the market.
Projections:
Best estimate for the price low of the correction is about 1052-55, with the possibility of 1044 if we are still in a weak period after Monday.
Breadth
The NYSE Summation index (courtesy of StockCharts.com) made a double-bottom and started to turn up, but it was prevented from making further progress by several days of poor A/D which affected the McClellan oscillator adversely. Its uptrend was stopped at the 50-DMA and, admittedly, it was a rather poor uptrend compared to the surge in the market. Perhaps a warning sign that this rally is not going very far.
Another perspective on the longer-term A/D is the following oscillator, which I constructed. The intermediate uptrend came to an end when the blue channel was decisively broken, and the intermediate downtrend which currently prevails will conclude when the red channel is decisively penetrated on the upside. The oscillator also has other merits such as identifying tops and bottoms and evaluating the strength of a shortterm trend.
Market Leaders and Sentiment
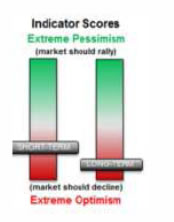
The SentimenTrader (courtesy of same) has remained bullish throughout the decline from 1220. I very much doubt if we will have a really important top until it turns completely bearish, like it was at the 1220 top. This is what it looked like, then:
This is what it looks like now:
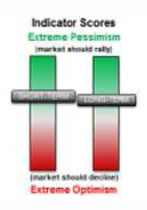
Current readings do not suggest that that the equity markets are immediately vulnerable to sustained aggressive selling.
The same applies to my interpretation of the NDX/SPX ratio chart which follows (courtesy of StockCharts.com). The relative strength of the NDX has even improved slightly in the past two weeks.
Gold
This week, we'll look at the weekly chart of GLD. It clearly shows the position of the ETF. The long-term trend is outlined in green. The intermediate trend in black.
As the labeling suggests, GLD may have completed a structural pattern which now requires a protracted period of consolidation. The only ambiguity that remains is whether or not the last "wave 5" is complete. That phase met its minimum P&F projection, but there is also a count to 128 which could still be filled. It will depend on whether the ETF holds above the black trend line or punches through it on the downside. The negative divergence in the indicators warn that this could happen.
Summary
The SPX has reluctantly fulfilled the requirements for an established intermediate downtrend. Several factors suggest that it will not be a protracted downtrend, but a fairly shallow corrective pattern which will end in October with the bottoming of the 4-yr cycle.
Last Friday's sell-off is likely to be only an interim correction within the rally which started at 1011.
Announcement: My old website is down permanently. A new one is being built which should be ready in about a week.
If precision in market timing is something which is important to you, you should consider a trial subscription to my service. It is free, and you will have four weeks to evaluate the claims made by the following subscribers:
Thanks for all your help. You have done a superb job in what is obviously a difficult market to gauge. J.D.
Unbelievable call. U nailed it, and never backed off. C.S.
I hope you can teach me about the market and the cycles. I want to be like you and be the best at it. F.J.
But don't take their word for it! Find out for yourself with a FREE 4-week trial. Send an email to ajg@cybertrails.com .
By Andre Gratian
MarketTurningPoints.com
A market advisory service should be evaluated on the basis of its forecasting accuracy and cost. At $25.00 per month, this service is probably the best all-around value. Two areas of analysis that are unmatched anywhere else -- cycles (from 2.5-wk to 18-years and longer) and accurate, coordinated Point & Figure and Fibonacci projections -- are combined with other methodologies to bring you weekly reports and frequent daily updates.
“By the Law of Periodical Repetition, everything which has happened once must happen again, and again, and again -- and not capriciously, but at regular periods, and each thing in its own period, not another’s, and each obeying its own law … The same Nature which delights in periodical repetition in the sky is the Nature which orders the affairs of the earth. Let us not underrate the value of that hint.” -- Mark Twain
You may also want to visit the Market Turning Points website to familiarize yourself with my philosophy and strategy.www.marketurningpoints.com
Disclaimer - The above comments about the financial markets are based purely on what I consider to be sound technical analysis principles uncompromised by fundamental considerations. They represent my own opinion and are not meant to be construed as trading or investment advice, but are offered as an analytical point of view which might be of interest to those who follow stock market cycles and technical analysis.
Andre Gratian Archive |
© 2005-2022 http://www.MarketOracle.co.uk - The Market Oracle is a FREE Daily Financial Markets Analysis & Forecasting online publication.