Stock Market, Dollar and Gold Trend Facts
Stock-Markets / Financial Markets 2010 Jul 22, 2010 - 02:21 PM GMTBy: Steve_Betts
 I’ve known for a long time that elections were all about money, but I never realized just how bad and broad the problem was until I read that most of the sitting judges along the Gulf Coast receive donations from big oil. Big money has its hand in everything and it is the dominant force in the United States today. It elects your government, decides how you live, decides what and how you eat, where you can go and where you can’t, and what kind of life your children will live. It’s the modern version of the old fashioned “company store”, the theme from Tennessee Ernie Ford’s song “Sixteen Tons”.
The American electorate allowed that to happen and now the whole process has taken on a life of its own, like a cancer cell that multiplies, grows, and spins out of control. One day you’re feeling a little tired, you go to the doctor, he pulls out an x-ray and the next day you’re getting your affairs in order. There will good and bad days along the way, but the trend is set in stone and it is down. That’s where we are today.
The US government has spent anywhere from US $3 to US $9 trillion dollars so that twenty or so companies could report “blow out results”. These results are the combination of transferring debt from them to you and flouting generally accepted accounting practices. Big money has made this all possible. You on the other hand have yet to see a new water plant, sewage line, school, road or electric plant built in your city. Remember Obama standing there just after he was elected promising all of those things? Money for infrastructure! Well you’re going to have a long, long wait before any of that comes to pass. If I may paraphrase, hell will freeze over first. All of this is creating uncertainty in the markets and that’s why we’ve seen so much volatility; eleven 90% down days and nine 90% up days since April 26th. Just look at the last eight sessions with four triple digit changes, two up and two down. If you don’t like what you see, just go away and come back the next day and it all will have changed. That type of volatility is draining, like chemotherapy, and eventually it saps the life right out of the market and it collapses of its own weight. We are headed toward that end now.
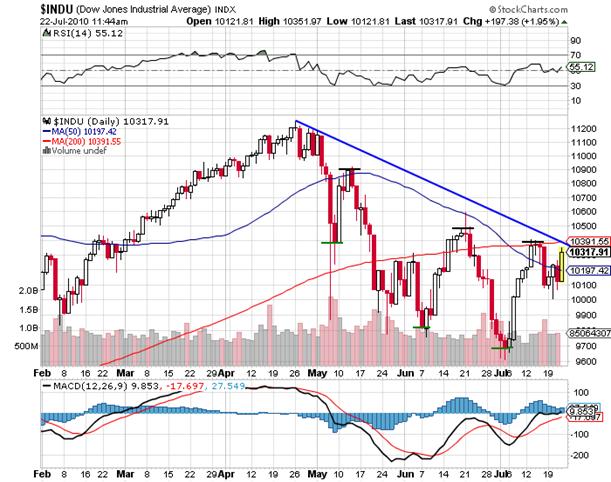
Whenever you have conditions like we see today, it’s best to leave the guesswork to everybody else and focus only on what you really know. That’s why I kept the preceding chart as simple as possible. So here’s what I know:
- The Dow topped at 14,164.53 on October 9, 2007.
- The Dow fell from the October 9th all-time high to 6,469.95 on March 10, 2009 giving back 57.7% of its bull market gains accumulated over twenty-five years.
- From the March 10th low the Dow rallied up to 11,258 on April 26, 2010 recovering 61.8% of the previously mentioned losses.
- From that April 26th high the Dow has carved out a series of three lower highs (small horizontal black lines) and three lower lows (small horizontal green lines).
- The upper band of the current trading range (descending blue line) has yet to be violated.
- Days with big losses have consistently heavier volume than days with big gains and that has been the case since the October 9, 2007 all-time high.
- The Dow did not confirm the all-time high in the Transports posted on May 26, 2008
- The Dow did not confirm the April 30, 2010 closing high, and
- The Dow closed below its February lows but the Transports have not closed below their respective February low. This is yet another non-confirmation as you can see below:
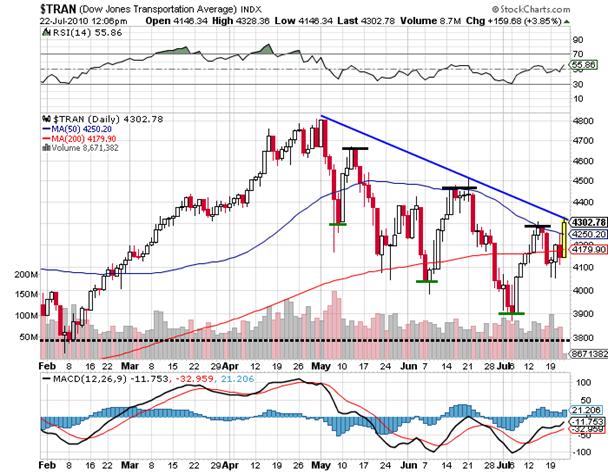
Whenever you analyze the market it’s always good to state just what you know and leave any opinions and suppositions to the CNBC crowd. To date I can see that the Dow has not violated the upper band of the descending trend lines that originate with the April 26th closing high while the Transports could be on the verge of doing so today.
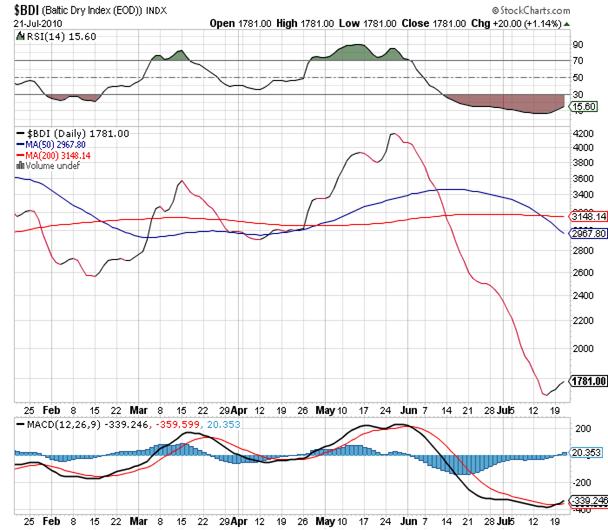
I also know that the Transports have a huge divergence with the Baltic Dry Index as you can see below. Compare the July decline in the BDI with the July rally in the Transports. It is supposedly common knowledge to say that China is responsible for the former, but that overlooks the fact that the BDI takes in goods shipped all over the world and that includes the United States!
If I want to expand what I know to the US economy as a whole, I see that consumption continues to decline, housing continues to fall, and unemployment continues to be a real problem. I know that the US is a consumption based economy and that consumption was financed by sucking money from constantly rising housing prices. I also know that real wages are declining and savings is actually increasing in the US. Finally, I know the level of debt in the US is truly staggering and continues to increase daily. The only solution on the table is to print money; it’s a one size fits all panacea that will eventually kill the patient. Hence the US dollar:
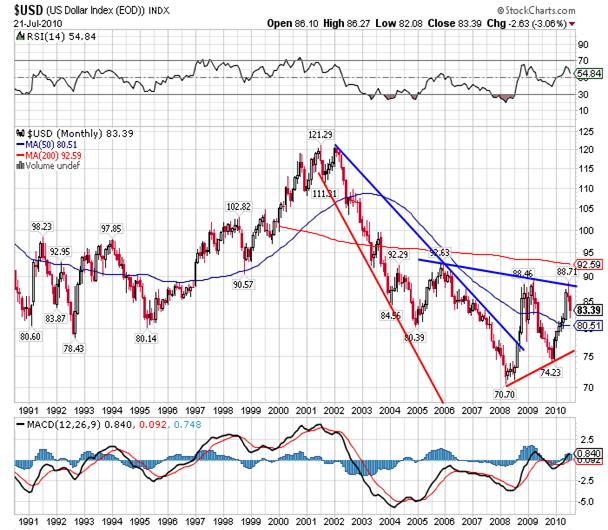
Think of the United States as a very large company and think of the US dollar as its common stock. As you can see the share price has been declining since 2001.
We have seen two significant reactions over the last two years, and the second one has apparently ended. Below I have posted a daily chart of the dollar that shows the break down and change in trend:
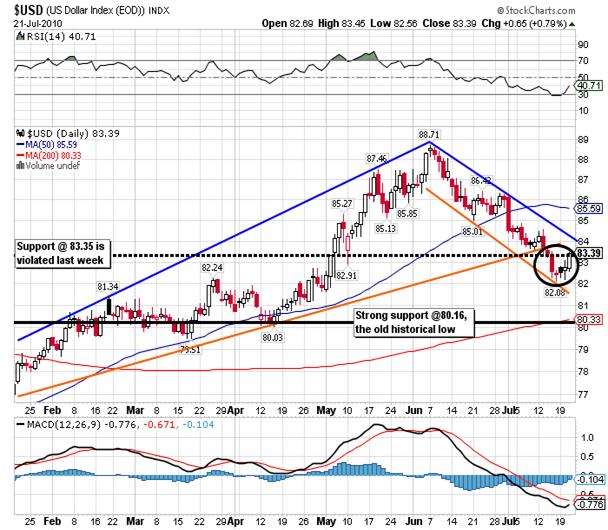
This produces a very strange combination of a declining dollar and a deflating economy and must have Bernanke staring at the ceiling in his bedroom at 3 am. I saw him in his testimony yesterday and he tries to hedge his bets but in the end he is forced to take a stand. Recently the dollar broke down out of its rising trading range (black circle) and then broke down through strong support at 83.35. After a brief reaction back up to 83.39, the greenback fell hard today and is trading at 82.56 as I type (1 pm EST). Once strong support at the old historical high of 80.16 is violated it will be clear to all concerned that the end is near and the dollar will become a financial pariah. Without going into detail, that’s why gold will not decline for more than a couple more weeks, and will not fall to US $850 as so many are predicting. Gold is experiencing a hiccup; no more and no less. So we have the primary in the Dow and dollar headed down, while the primary trend for gold is headed higher. That’s what I know and that’s real. Therefore you neither short the dollar and Dow or you stay out, and you either own gold or you stay out. Finally I know that going against the trend will take you into bankruptcy, and that concludes our lesson for today.
[Please note that the new website at www.stockmarketbarometer.net will become operational this week. Also, note that you can contact us at our new e-mails, info@stockmarketbarometer.net (general inquiries regarding services), team@stockmarketbarometer.net (administrative issues) or analyst@stockmarketbarometer.net (any market related observations).]
By Steve BettsE-mail: analyst@stockmarketbarometer.net
Web site: www.stockmarketbarometer.net
The Stock Market Barometer: Properly Applied Information Is Power
Through the utilization of our service you'll begin to grasp that the market is a forward looking instrument. You'll cease to be a prisoner of the past and you'll stop looking to the financial news networks for answers that aren't there. The end result is an improvement in your trading account. Subscribers will enjoy forward looking Daily Reports that are not fixated on yesterday's news, complete with daily, weekly, and monthly charts. In addition, you'll have a password that allows access to historical information that is updated daily. Read a sample of our work, subscribe, and your service will begin the very next day
© 2010 Copyright The Stock Market Barometer- All Rights Reserved
Disclaimer: The above is a matter of opinion provided for general information purposes only and is not intended as investment advice. Information and analysis above are derived from sources and utilising methods believed to be reliable, but we cannot accept responsibility for any losses you may incur as a result of this analysis. Individuals should consult with their personal financial advisors.
© 2005-2022 http://www.MarketOracle.co.uk - The Market Oracle is a FREE Daily Financial Markets Analysis & Forecasting online publication.


