


Stock Market Update: Trader's Best Friend
Stock-Markets / Elliott Wave Theory Sep 16, 2007 - 01:06 AM GMTBy: Dominick
 If last week kicked off the top of the ninth, then you could say we definitely saw some base hits and some runners advancing this week. You may have noticed we basically got a mirror image of the previous five days, finding a bottom on Monday and closing Friday near the highs. But, unless you're already a member of TTC , you probably didn't buy that Monday low. If you were like many, chances are you figured the bottom had dropped out after that employment number, that it was another 1987, or maybe we were about to get hit with another 9/11.
Last week I cautioned against using the anniversary as anything other than a chance to remember and honor the lives lost that day. That's exactly what we did – and then we traded the charts like we would on any other day because you can watch all the CNBC you want, or listen to all the bulls and bears in the world, but an unbiased chart, with the right numbers or count, is still a trader's best friend in the whole wide world!
Remember the last update included a composite of five charts we had used to navigate from the high on Sept. 4 to last Friday's lows. Having gotten the end of day weakness anticipated in the third chart, it wasn't difficult to foresee a move to the downside on Monday. But a bottom?
Well, yes – and, frankly, it was easy provided your weren't trading on the news or the chatter or some preconceived bias. Remember, unbiased means you can trade to the downside without giving in to some end-of-the-world crash scenario. Keeping the possibility of a bullish week in mind, and with no bearish count looking remotely plausible at that point, the following DOW chart was posted before the opening on Monday with our downside target.
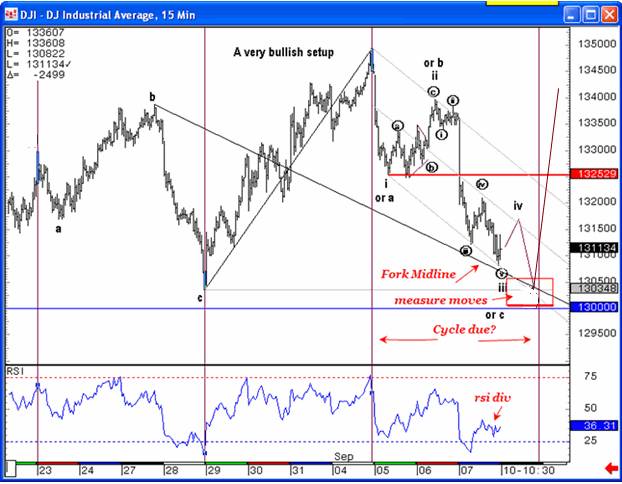
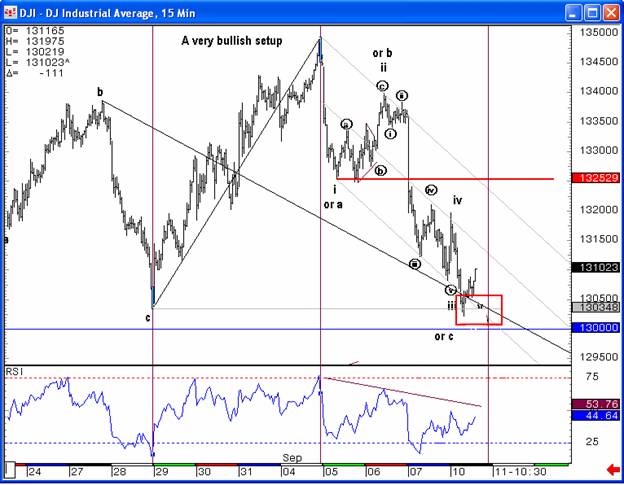
The gap up gave us the needed fourth wave, but that quickly evaporated under the pressure of all that crisis talk and, before noon, we were already in the target box. The timing of the decline into this particular low actually made it easier to trade than most because there wasn't the risk of buying into the close and facing an overnight move. In other words, it was fairly easy and low risk to put on some longs with a firm stop and watch for the index to move up out of the box by the end of the day. Sure enough, the move was choppy, indicating a real struggle, but the market clearly had its sites set higher. By 1:30, the chart looked like this:
As the chart says, this is clearly a bullish setup and swing traders who got into the long trade could have just sat on their position for the whole week. Of course, as usual, we found some nooks and crannies for the scalpers anyway and these had to do with those now famous numbers we mentioned last week. The last update mentioned 1467 in the S&P futures and once again you only need to look at a chart to see how the market continued responding to this critical level.
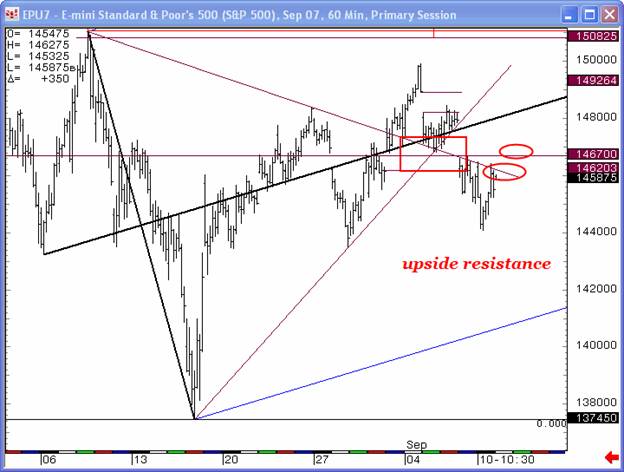
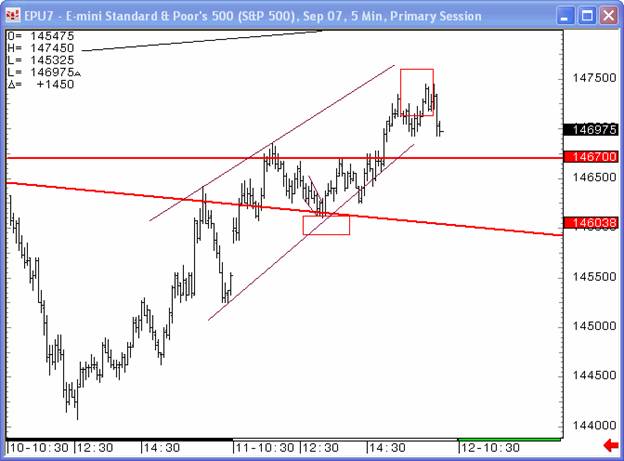
In fact, for at least a month now we've been keying off of this number, among others, reacting to the choppy, rangebound market, rather than trying to force our expectations or read into the economic data like so many tea leaves. In turbulent times, our numbers are reliably unbiased and whether the indices vibrate around them, find support or hit resistance, they provide excellent trade setups week after week. Of course, every trade has to have entry and exit points and we usually reserve at least one of these for members only. But, as you can see in the chart below, as the S&P moved off the lows up to 67 and then retraced back down, we zoomed in to a 5-minute chart and found another long entry point for the quick and the brave.
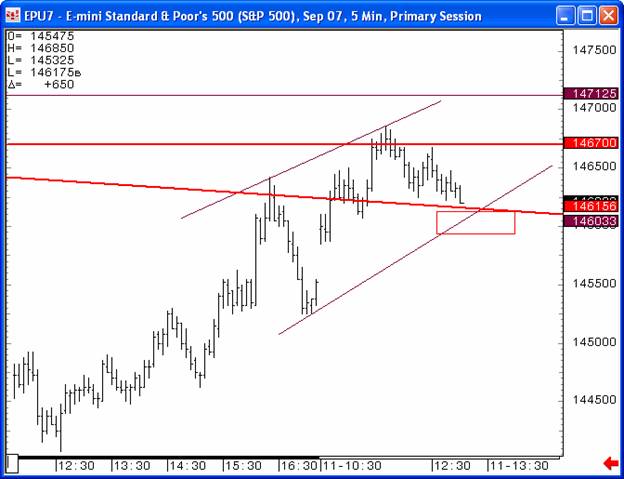
The safest exit point for this trade was to simply sell the return to 67 as the market vibrated there for a few hours. But, for traders with a little more risk tolerance, we posted a 72/76 target. The chart below shows this target box captured the top of the move quite nicely.
Of course, getting out of a long trade doesn't automatically mean it's time to short, but you better believe we saw an opportunity when the market quickly sagged back down to and held 1467!
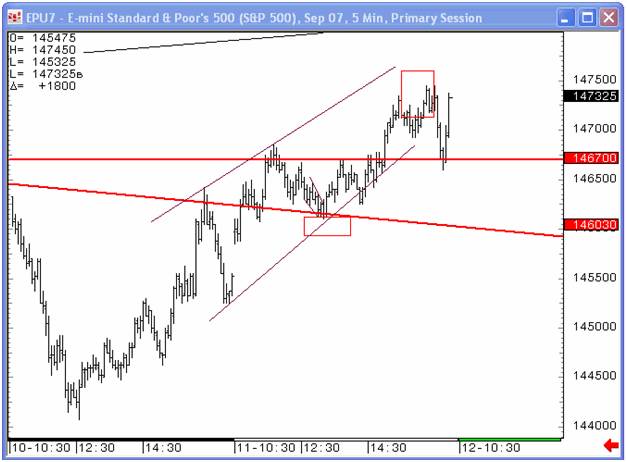
And, as you probably know, the markets moved higher from there and haven't looked back, at least not to 67, since! We had a sreong pattern idea going into Thursday, which gave us an upside target that happened to coincide perfectly with one of our numbers (1491) and also happened to be the exact top for the week. That did seem to be an excellent area to switch and get short, and we were vindicated by the gap down on Friday, back into our previous 72/76 target box, which resulted in 15 points profit.
The gap down open on Friday also gave us an opportunity to do a few other things we do really well at TTC. The first was to practice what I call “rolling analysis”, meaning that we trade the chart that works in any given moment but are always ready to abandon a count or pattern, or target or chart, if the market proves us wrong. In this case, I suggested we abandon the triangle pattern and TMAR (“take the money and run”), which is another thing we do well, and the reasons are simple. Not only had the gap down taken us back to our previous target level, but the move also exposed us to a potential impulsive upward move. Booking 15 points and reassessing the situation is always good in my book. But I guess the fact that the market quickly reversed and closed positive for the day, totally validating the call, wasn't so bad either.
Usually I close these updates with some outlook for the future. Today will be a little different because I don't honestly think it matters what I think at this juncture. After getting out of the short Friday morning, it didn't seem to make sense guessing about where the market would wander the rest of the day, not with the Fed, the brokers, and option expiry all looming next week.
So, I didn't take a position then and I'm not going to bias my readers now with so much news about to jump on the tape. I will say, though, that I'm fairly proud to have had the discipline not to have commented on whether the July highs were the “top” because that left me and my members unbiased and free to trade this range bound market in both directions for the last two months. I mean, if you were convinced that July was the top for sure, could you have bought Dow 13000 on Monday or SPX 1375? We did and also traded hundreds of S&P points as the markets remain in a range.
As we go into next week and what looks to be a Fed rate cut, the fact that we're only 70 points from the all-time high in the S&P can only be bullish – I mean, that distance could feasibly be covered in a day or two, let alone a week. Still, we can't allow ourselves to put blinders on now because, as I mentioned last weekend, we are approaching what could be major reversals, not just in the Dow and S&P, but in a wide range of markets including currencies, oil, gold, and commodities. So, I'll end, then, with the latest update on my gold chart below, a reminder to read Joe's article for more on the metals, and the promise that we'll be all over the markets whichever way they break over the next few days and weeks, not by watching the news or interpreting the economic data, but by trading the charts because they are, after all, a trader's best friend.
Members
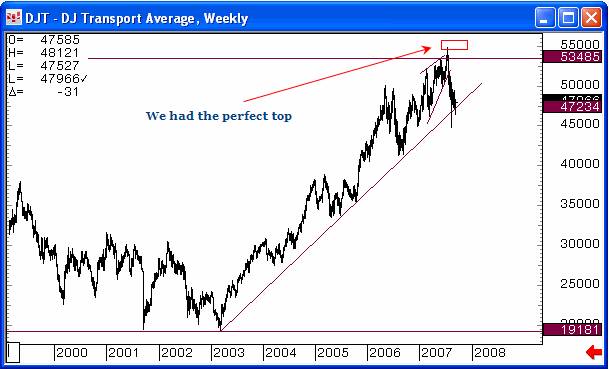
Finally, be sure to check out our weekly “road maps ” as that's where the real big picture shapes up, where we compile charts of any market that talks to us, ranging from a look at the last few weeks to huge timeframes all the way back to the 1900's. Remember the chart below of the Dow Jones transports where we found the exact top.
Non-members
Gold
Gold continues to follow our precise path for the last 2 weeks. The chart on the left was posted to members before any breakout and the chart on the right shows the advance from that breakout.
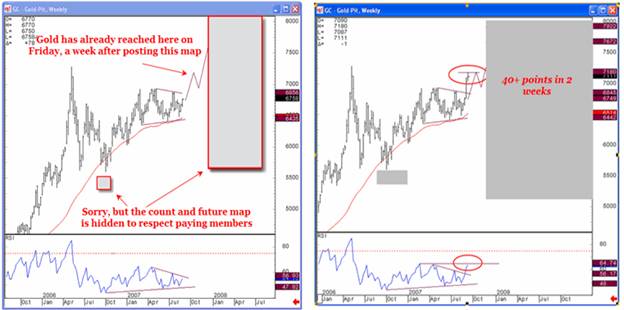
“Unbiased Elliott Wave works!”
By Dominick
For real-time analysis, become a member for only $89
If you've enjoyed this article, signup for Market Updates , our monthly newsletter, and, for more immediate analysis and market reaction, view my work and the charts exchanged between our seasoned traders in TradingtheCharts forum . Continued success has inspired expansion of the “open access to non subscribers” forums, and our Market Advisory members and I have agreed to post our work in these forums periodically. Explore services from Wall Street's best, including Jim Curry, Tim Ords, Glen Neely, Richard Rhodes, Andre Gratian, Bob Carver, Eric Hadik, Chartsedge, Elliott today, Stock Barometer, Harry Boxer, Mike Paulenoff and others. Try them all, subscribe to the ones that suit your style, and accelerate your trading profits! These forums are on the top of the homepage at Trading the Charts. Market analysts are always welcome to contribute to the Forum or newsletter. Email me @ Dominick@tradingthecharts.com if you have any interest.
This update is provided as general information and is not an investment recommendation. TTC accepts no liability whatsoever for any losses resulting from action taken based on the contents of its charts, commentaries, or price data. Securities and commodities markets involve inherent risk and not all positions are suitable for each individual. Check with your licensed financial advisor or broker prior to taking any action.
Dominick Archive |
© 2005-2022 http://www.MarketOracle.co.uk - The Market Oracle is a FREE Daily Financial Markets Analysis & Forecasting online publication.